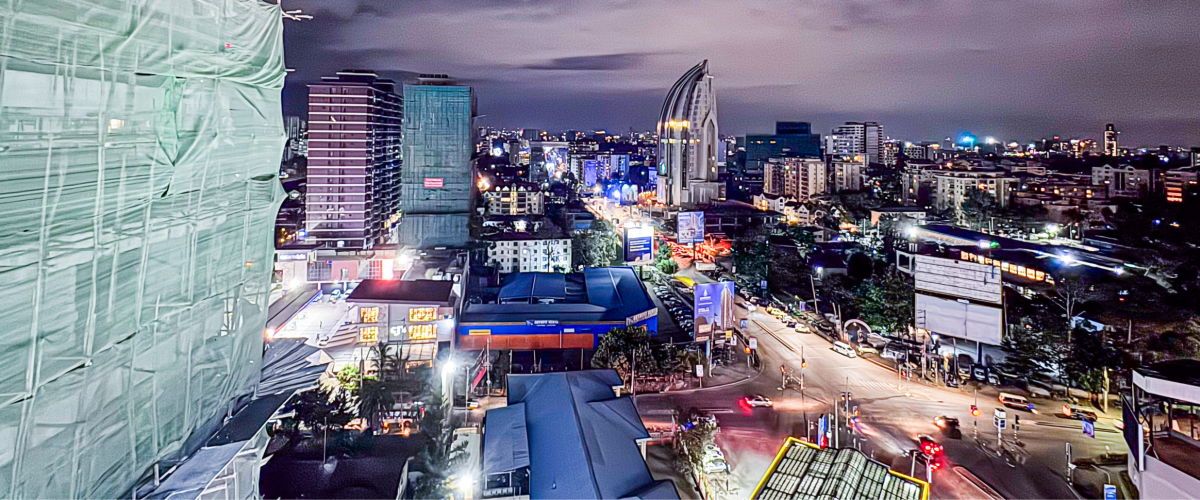
Stand on a rooftop in Nairobi at dusk and two Kenyas come into view. Above the skyline, glass towers glow over a city that runs the regional headquarters of Google, Microsoft and Visa and hosts the United Nations’ only global headquarters in the Global South, home to UNEP and UN-Habitat. In the street below, a trader folds up her stall and pays her supplier with a tap on a worn handset, one of the 76.7 million active SIM lines registered for a population of about 56 million, a mobile penetration above 145 percent,1 on a market that M-Pesa dominates, with 47.7 million active mobile-money accounts and a 91 percent share.2 She is also one of the more than 8 in 10 Kenyans whose work is informal, with no contract and no protection.3 Same skyline, two worlds.
The figures behind that skyline are big. In 2025 Kenya quietly passed a milestone it had chased for a decade: with output of about US$136 billion in 2025 (KES 17.58 trillion), it overtook Ethiopia, now about US$109 billion, to become the largest economy in East Africa.4 It has topped Africa’s rankings for startup capital in recent years, pulling close to $1 billion to its founders in a single year.5 Renewables supplied 80.2 percent of its electricity in the year to June 2025, geothermal steam from the Rift Valley being the single largest source at 39.5 percent.6 Its diaspora wired home US$5.04 billion in 2025, more hard currency than tea, tourism or any single export earns.7 And it is young in a hurry: 3 in 4 Kenyans are under 35.8 None of this is promise. It is already built.
And yet. The largest economy in the region is also the slowest-growing of its major neighbours.9 It is courted by global investors as a rising star, and 39.8 percent of its citizens still live below the national poverty line.10 And in June 2024 a generation of young Kenyans, organised on TikTok and X with no leader and no party, marched on their own Parliament and briefly stormed the chamber rather than pay for the government’s budget gap. This article is about the distance that protest exposed: the gap between how Kenya’s growth looks from the outside and what it is actually made of on the inside.
That gap is the single most important thing to understand about the country today, whether you are a Kenyan worker, a finance minister in Nairobi, or an investor in Lagos, London or Shanghai weighing a continental bet. To make sense of it we will do two things at once: take the full measure of what is remarkable about Kenya’s rise, and then open the engine of that rise with four simple tools, each in plain language, to see what is really driving it. The conclusion is not that Kenya is failing, far from it: Kenya has won the easy contest, size, while the one that decides a country’s future, whether the boom reaches its people, is still wide open.
The Kenya the world has started to notice
Begin with the achievement, because it is impressive, and because Kenya did not merely grow; it invented things the rest of the world now copies. Mobile money was born here in 2007, and today a Kenyan pays a market trader, a hospital, a landlord or a solar-power supplier with a few taps on the most basic handset, with M-Pesa alone carrying more than 9 in 10 of them. A country much of the world still pictures as poor leapfrogged the bank branch and the chequebook altogether and built, on the phone, a financial system that richer nations are still trying to imitate.
That digital edge is now drawing the world’s biggest names. Microsoft and the Emirati group G42 are building a data centre worth around $1 billion, run on Kenya’s geothermal power, the largest private digital investment in the country’s history.11 The reach is more tangible than servers, too: the roses in a European supermarket bouquet were most likely cut the day before near Lake Naivasha and flown overnight to the auctions of Amsterdam, for Kenya is one of the world’s leading flower exporters.12 The emergence is no slogan: it is broad-based, and it is precisely why the stakes of the rest of this article are so high.
The rise is genuine. So is the crack beneath it.
Now look underneath. Real growth has slowed for three straight years, from 5.7 percent in 2023 to 4.7 percent in 2024 and 4.6 percent in 2025, the weakest pace since the pandemic.13 Over the same year East Africa as a whole grew by 6.4%, the fastest of any African region.14 Put simply, the biggest economy in the neighbourhood is now growing more slowly than the neighbourhood; Ethiopia, Rwanda and Uganda are all pulling ahead on pace.
This is not a crisis, and it would be wrong to read it as one. The slowdown came wrapped in real macroeconomic stability: a shilling holding near 129 to the dollar and official reserves of US$13.24 billion in June 2026, 5.6 months of import cover. Stability, though, is no longer the whole story: inflation, which averaged 3.8 percent in 2025, had climbed to 5.6 percent by April 2026, rising on fuel, food and transport but still within the Central Bank’s 2.5 to 7.5 percent band.15 Where Ethiopia reached an IMF rescue only after a forced devaluation, Kenya kept its money convertible and its capital account open throughout. The country has traded a little speed for a great deal of predictability, exactly what long-term investors prize. The honest question is not whether Kenya is stable. It plainly is. It is what kind of growth that stability is protecting, and that is where the celebration has to give way to the diagnosis.
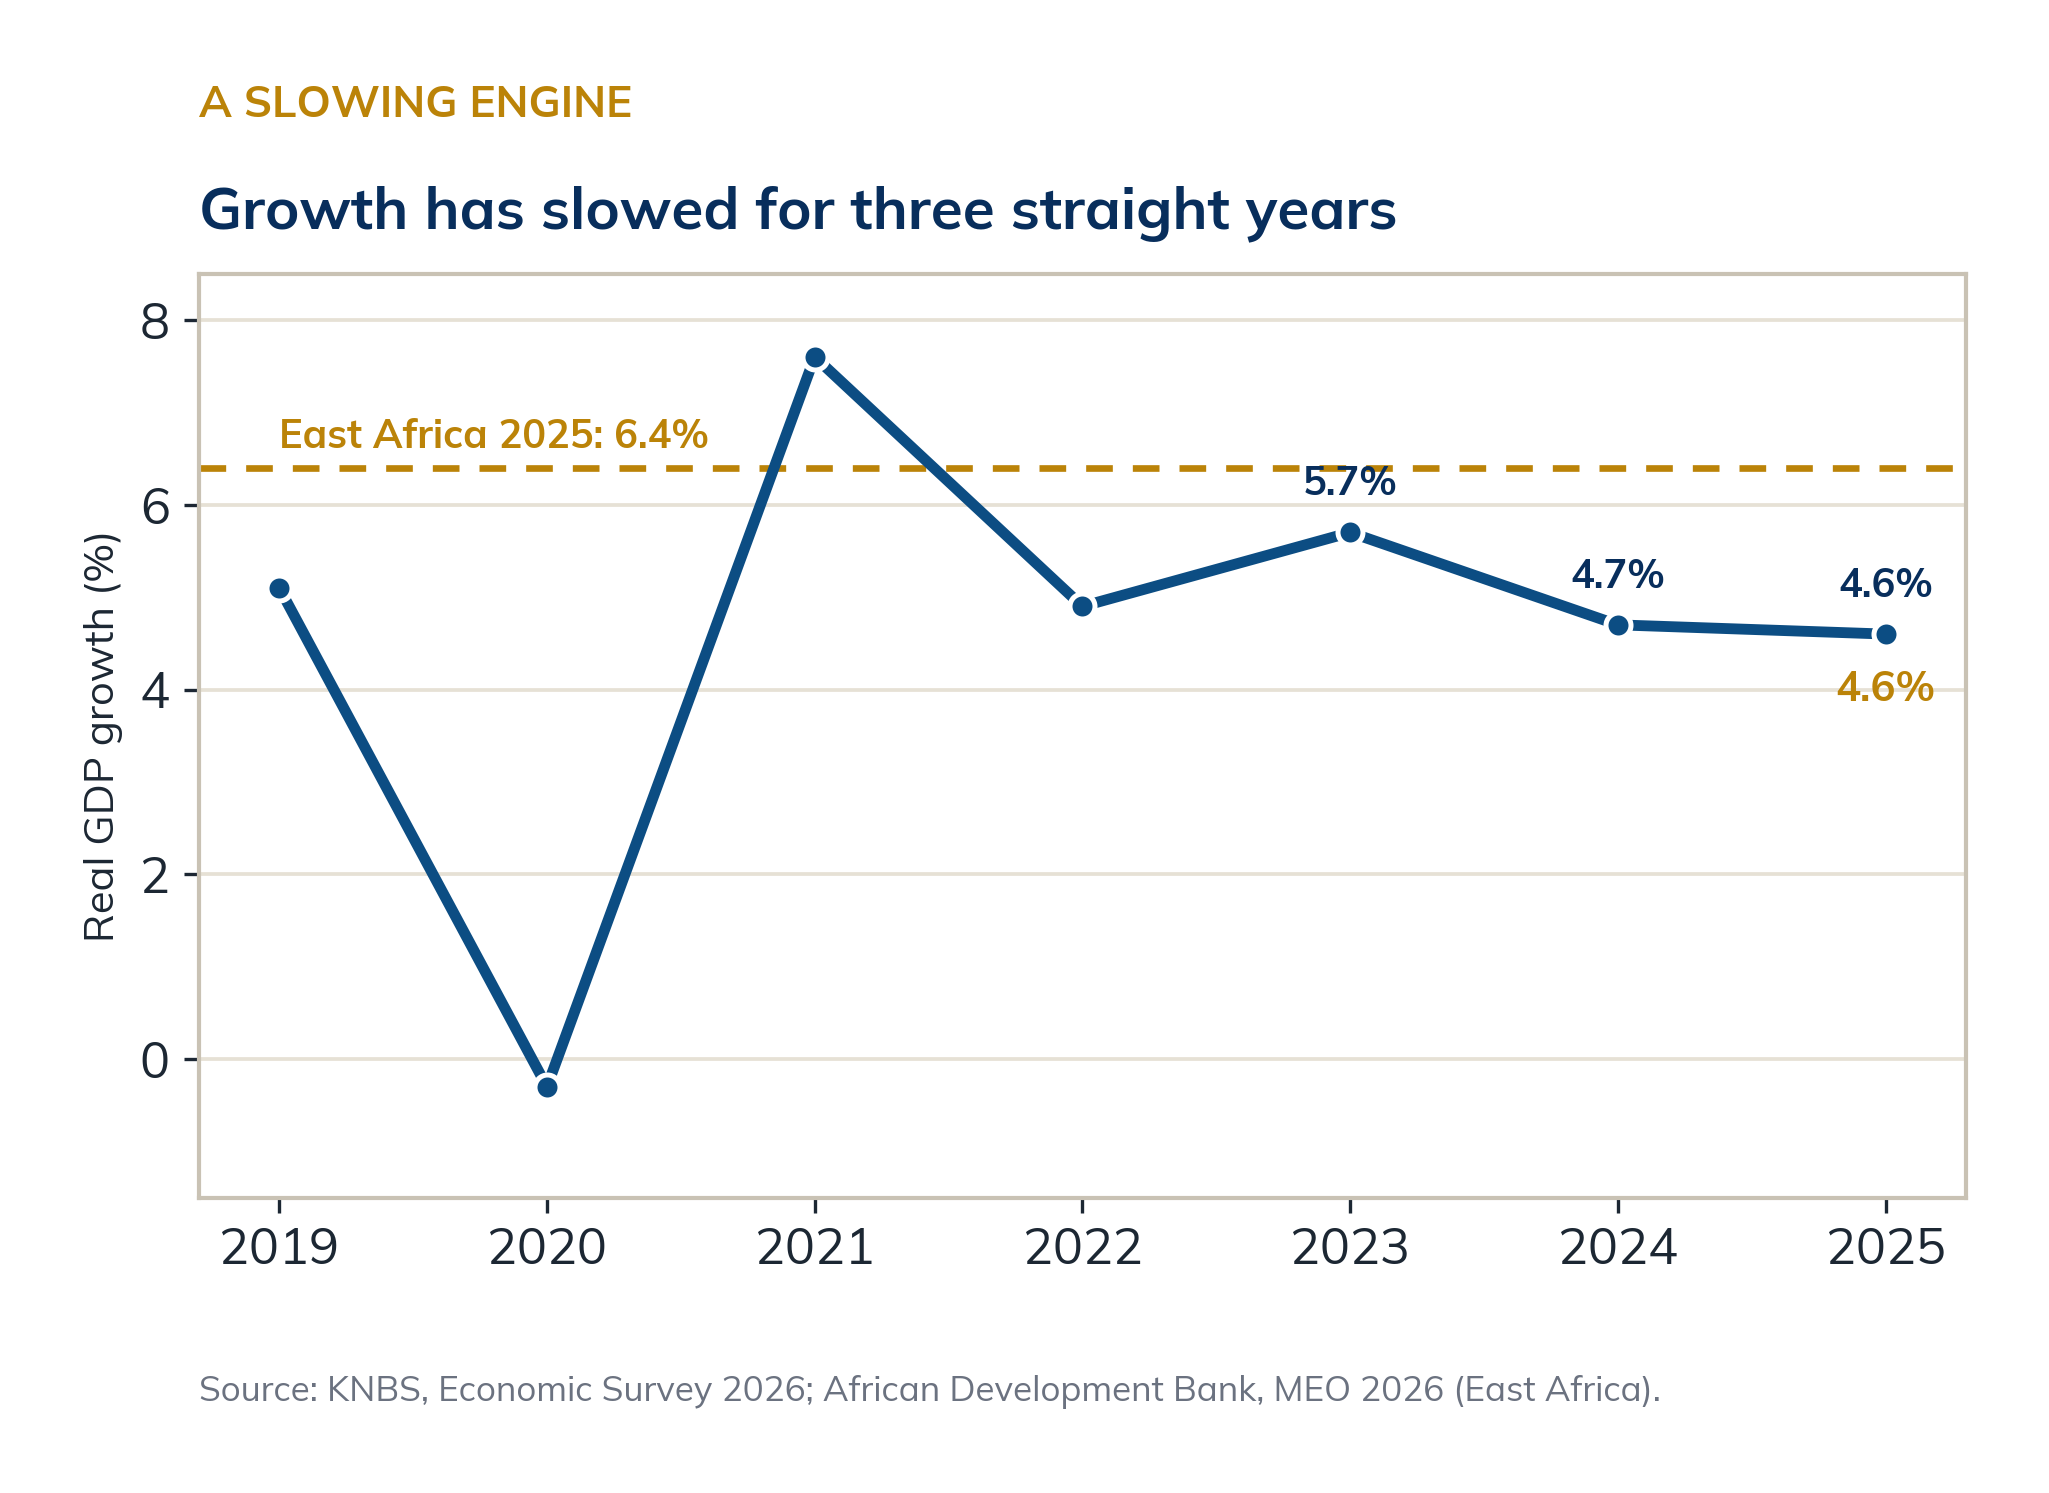
Real GDP growth, Kenya 2019 to 2025, against the East African benchmark for 2025.
To judge an economy, ask what its growth is made of
Economists open the engine with a method called growth accounting. The idea is simple. An economy can grow for three reasons: it uses more machines, buildings and roads (more capital); it puts more people to work (more labour); or it uses what it already has more cleverly (higher productivity). That last ingredient, the efficiency with which inputs combine, is the magic one, because it is the only source of growth that never runs out.16 That priority is a choice of school, not a neutral fact: productivity is measured as the residual left once capital and labour are counted, and the residual shifts with the assumptions made about the capital stock and its depreciation. The accumulationist reading of the East Asian miracle, Young and Krugman, saw mostly perspiration, more capital and labour, where the productivity-first tradition of Solow, and of Easterly and Levine, saw inspiration. This article takes the productivity-first view with that caveat in plain sight.
METHODOLOGICAL BOX · WHERE GROWTH COMES FROM
gY = α · gK + (1 − α) · gL + gA
In words: growth (gY) equals the contribution of more capital (gK), plus more labour (gL), plus the productivity gain (gA) from using both better. A country that grows only by piling on capital and workers, with little productivity gain, is running on brute force, and brute force meets diminishing returns.
Applied to Kenya, the verdict from the research is consistent. Growth-accounting studies, from analyses of the 1970s and 1980s to recent work, find that most of Kenya’s output growth is explained simply by adding inputs, more capital and more workers, while total factor productivity, the efficiency term, has been weak, volatile and in several periods outright negative.17 In one well-known result, productivity made no net contribution to growth between 1970 and 1985; later studies confirm a thin and unstable productivity record, even as a few argue it has lately begun to improve. The conclusion holds: Kenya grows mainly by accumulation, not by efficiency, and accumulation without rising productivity eventually tires.
Table 1. The sources of Kenya’s growth: what the evidence shows.
| Source of growth | Role in Kenya’s growth | What the studies find |
|---|---|---|
| Capital accumulation | Primary driver | Most output growth explained by a rising capital stock |
| Labour | Major driver | Labour-surplus economy; employment a large contributor |
| Total factor productivity (efficiency) | Weak and volatile | Little or no contribution in many periods, negative in several |
Directional summary of growth-accounting studies on Kenya (Solow and Cobb-Douglas framework, 1970s to recent), with AfDB and KIPPRA productivity analyses. The recurring finding: growth driven by inputs, with total factor productivity weak, volatile and in several periods negative.
A country grows only as fast as it invests, and Kenya invests too little
If growth runs on accumulation, how much a country invests sets its speed limit. The oldest rule in development economics says it in one line.
METHODOLOGICAL BOX · THE SPEED LIMIT
g ≈ s ÷ v
Sustainable growth (g) is roughly the investment rate (s, the share of income put into new capital each year) divided by how much investment it takes to produce 1 extra unit of output (v). You grow faster by investing more, or by investing more wisely, or both. This is a heuristic, a first approximation rather than an exact law; what matters is the direction, not the decimal.
On the first lever Kenya is structurally short of fuel. It invests 17.7 percent of its income each year (gross fixed capital formation, 2024), below the sub-Saharan average and far below the 30 to 42 percent that financed South Korea, Vietnam and China at their take-off.18 The arithmetic here is descriptive, not predictive: with an incremental capital-output ratio of about 3.8, itself read off recent data rather than assumed, a 17.7 percent investment rate maps onto growth of roughly 4.7 percent. That mapping rests on a strong and questionable assumption, that the capital-output ratio holds steady; if Kenya simply allocated capital better, the same 17.7 percent could sustain faster growth, so the figure marks current efficiency, not a fixed ceiling. The value of the exercise is not the decimal but the bridge it reveals between the two frameworks. The ratio v is exactly where productivity enters: a more efficient economy turns the same investment into more output, a lower v and a higher ceiling. Raising productivity and raising investment are therefore not rival strategies but one project seen twice, getting more growth out of each shilling put to work. Kenya is short on both counts at once.
Read the same identity backwards and it turns into a comparative lens, one that isolates the part of growth lying between brute accumulation and pure productivity. Rearranged, v is simply s divided by g: an economy’s incremental capital-output ratio is its investment rate over its growth rate. Kenya’s comes to about 3.8, meaning it currently takes close to four units of investment to add one of output. The figure is ordinary; its use is comparison. An economy investing the same share but running a lower ratio grows faster, and that ratio is where infrastructure, skills, project selection and the choice between a shopping mall and a factory all register. It is the lever Kenya can pull without first raising its savings rate or staging a productivity revolution: the same 17.7 percent, allocated better, would buy more growth. This efficiency-of-investment channel, short of total factor productivity but well beyond mere accumulation, is the one the rest of this series follows most closely.
The shortfall, moreover, is one of saving before it is one of channelling. Kenyans save only about 13 percent of national income, well short of what their investment rate requires and far below the world average of roughly a quarter, so the difference is made up by borrowing from abroad.19 The instinct to save is nonetheless deep and visible: the regulated SACCO movement alone holds around KES 1.08 trillion in assets, close to 6 percent of GDP, for some 7.4 million members, and the informal chamas mobilise more still. The capital exists in the society. What is missing is the formal, investable channel, and a national savings base, to turn it into the factories, ports and power lines that raise the ceiling. It is worth adding that the economies Kenya is measured against did not simply decide to invest more: South Korea, and later Vietnam and China, mobilised savings through financial repression and state-directed credit, captive institutions that funnelled domestic savings into industry. Kenya, with a liberalised financial sector and an open capital account, cannot copy that machinery, which is part of why the comparison is a benchmark of scale rather than a template.20
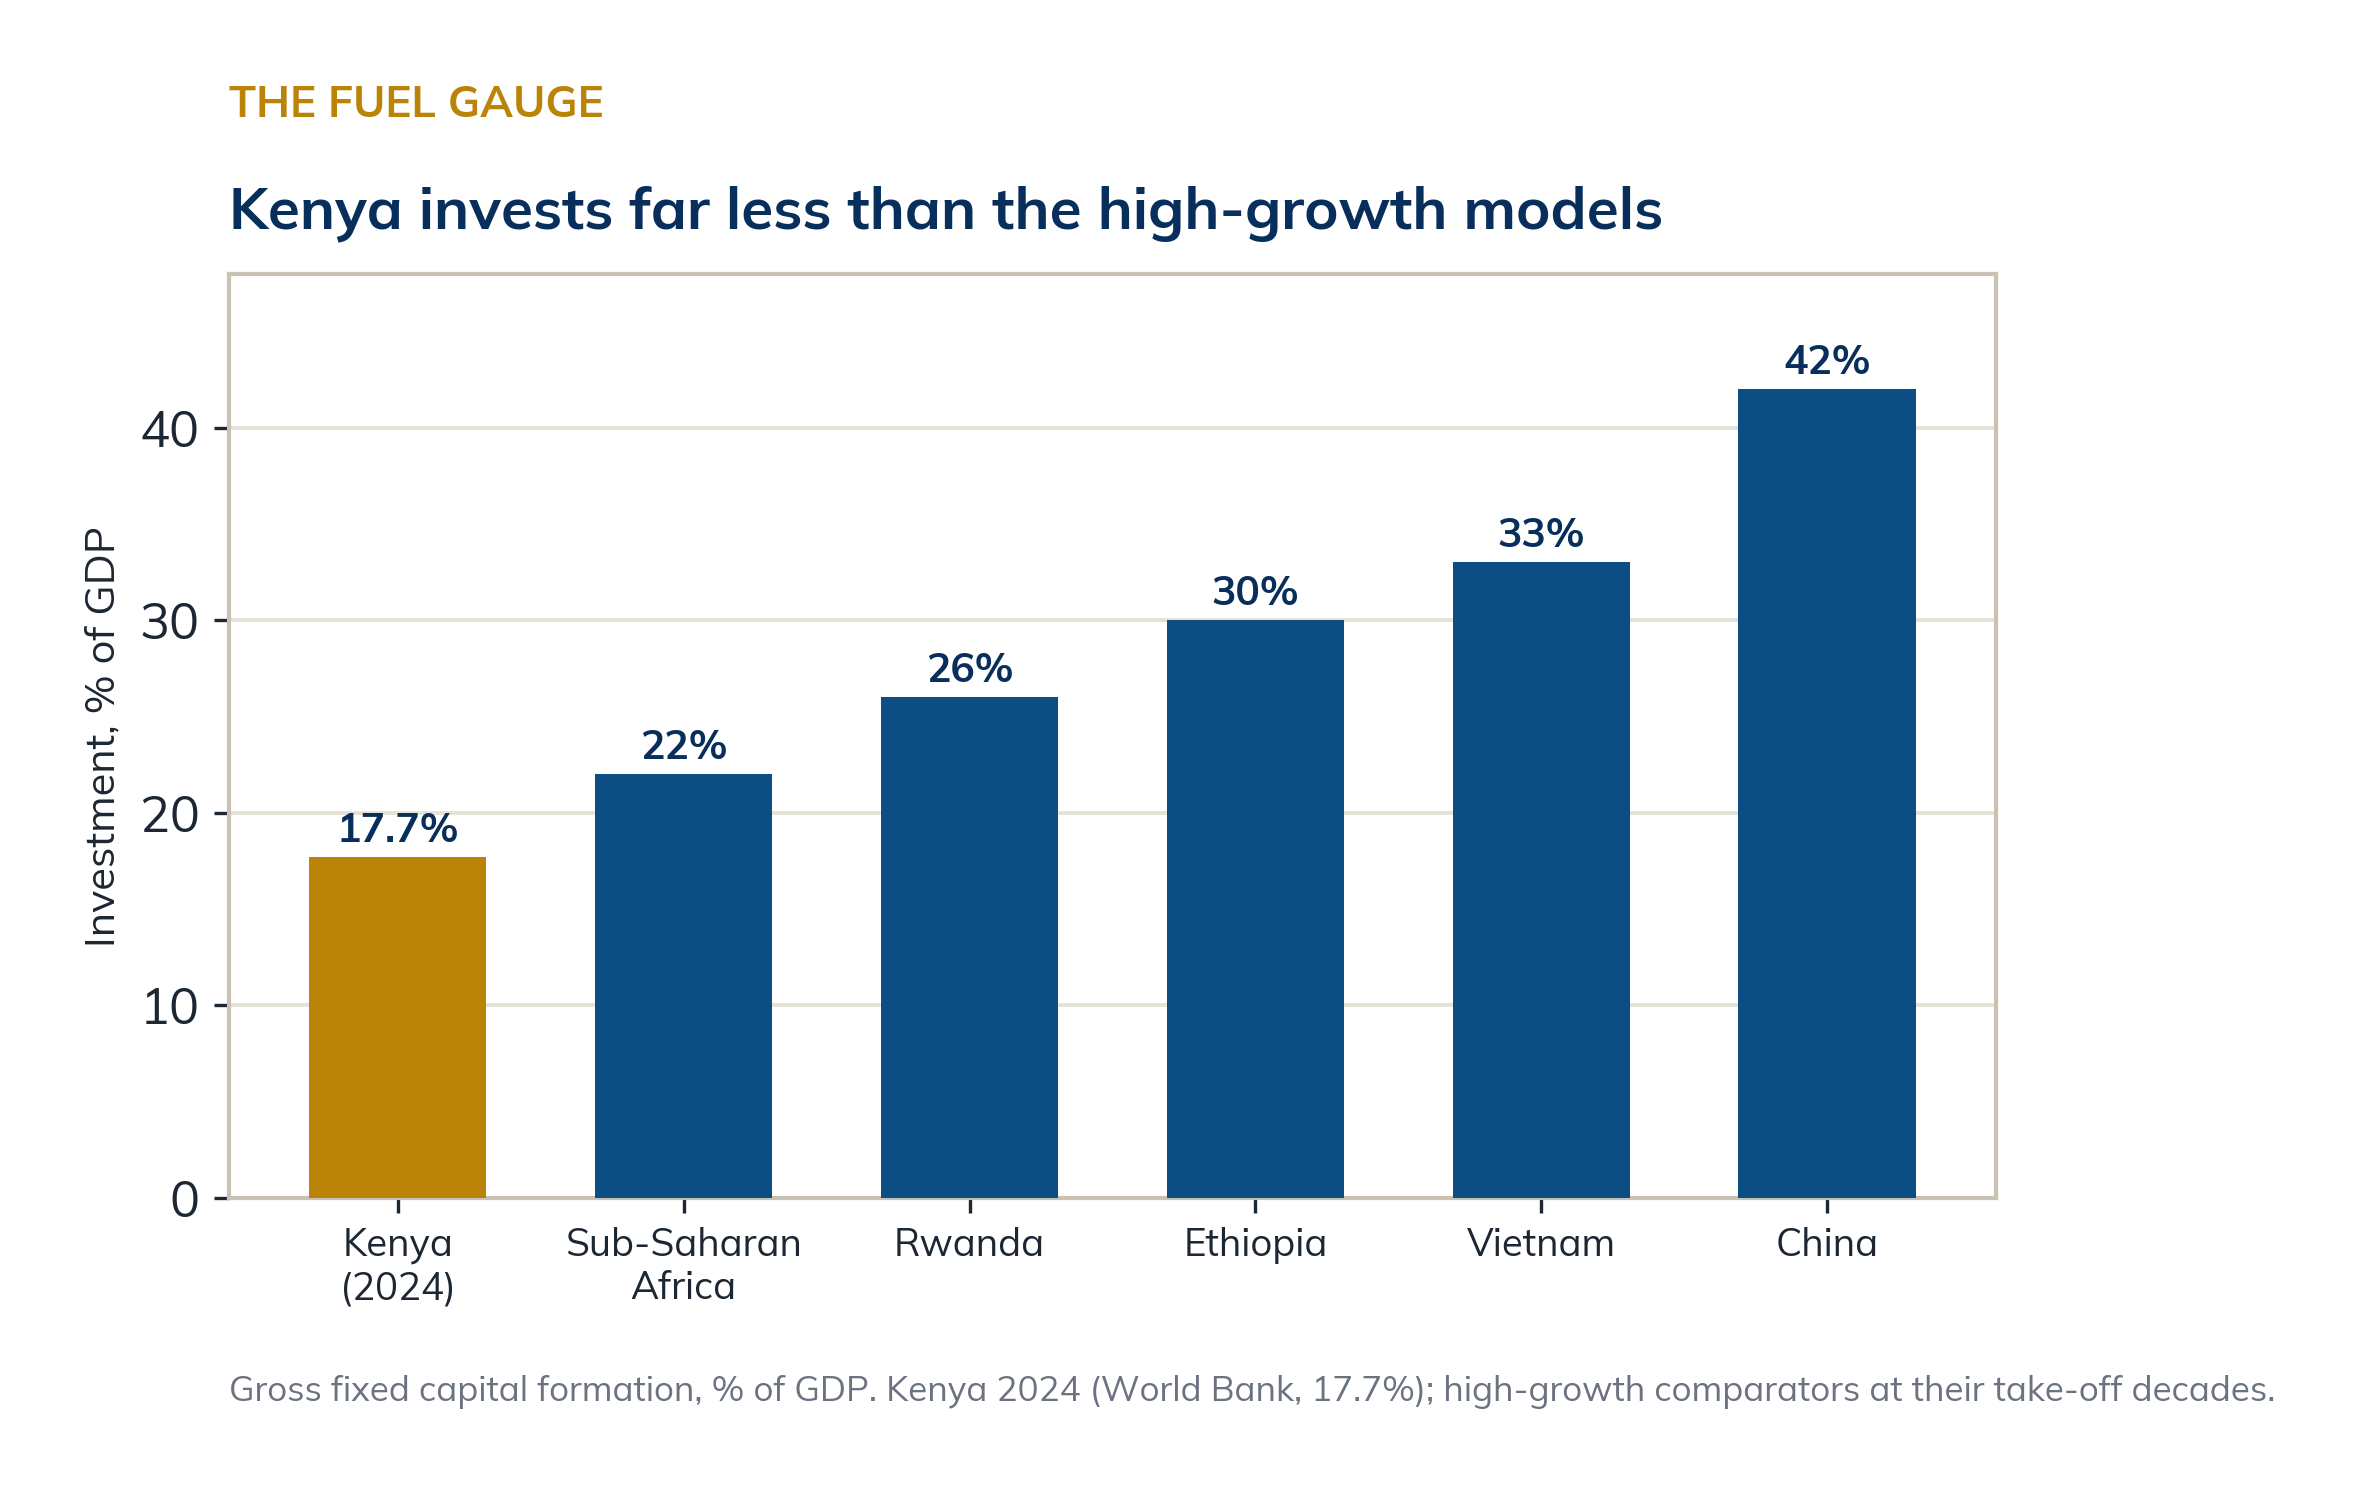
How much each economy invests: Kenya against the high-growth models.
There is also a reason the state cannot make up the difference, and it sits in plain view in the budget. Servicing the public debt now absorbs about 69 percent of government revenue, more than double the level the IMF treats as prudent, and interest payments alone have climbed from 18 to 25 percent of all public spending in four years.21 Recurrent commitments, debt service and the public wage bill together take roughly 73 percent of the budget, leaving a thin margin for the roads, power, ports and clinics that public investment is meant to build. The debt does not only raise the risk of distress; it crowds out the very capital spending that would lift the growth ceiling. The fiscal arithmetic and the growth arithmetic turn out to be the same arithmetic.
The second lever, investing wisely, is where the services tilt both helps and hurts. Money put into services and real estate often pays off quickly, which flatters the short-run numbers, but it builds less of the productive, export-capable capacity that compounds over decades. A shopping mall raises output once; a factory or a port keeps raising it. Kenya’s task is double: to invest more, and to steer that investment toward the tradable, productive sectors that lift productivity rather than the consumption-serving activities that merely circulate it.
The economy is creating jobs. It is not creating the right ones.
Nowhere does the quality of growth show more starkly than in the jobs it makes. The link is one ratio.
METHODOLOGICAL BOX · HOW MUCH WORK GROWTH CREATES
ε = (ΔL ÷ L) ÷ (ΔY ÷ Y)
The employment elasticity: the percentage rise in jobs for each 1% of growth. Near 1, growth is rich in jobs; near 0, it leaves work behind. What matters most is not the headcount but the elasticity of good, formal, productive jobs.
In 2025 Kenya created 822,100 jobs, a fine headline.22 But the composition empties the comfort out of it. About 716,800 of them, 87.2 percent, were informal: street vending, casual labour, small unregistered trades with no contract, no protection, low productivity. Formal, wage-paying employment, the kind that pays tax, offers security and raises living standards, grew by only about 105,000. Against demography it is brutal: with around 1 million young people entering the labour market every year, only about 105,000 found formal work: barely one in ten of the new entrants, and fewer than one in eight even of the jobs actually created. Wage employment is just 15.3 percent of the 21.6 million recorded jobs, and the KNBS real-wage index has slipped to 85.84 (2009 = 100), so the average worker’s pay buys less than it did over a decade ago. A young graduate in Nairobi today is statistically more likely to end up hawking goods in traffic than to find a salaried post, and she knows it. None of this disparages the informal economy: Kenya’s jua kali is inventive, resilient and the backbone of daily life. The problem is not that it exists, but that nothing pulls it upward, into firms that can raise productivity, pay more and grow. Walk through Gikomba market at first light, or watch the boda boda riders thread the morning traffic, and you are looking at the real labour market: millions of micro-entrepreneurs improvising a living the formal economy never built for them.
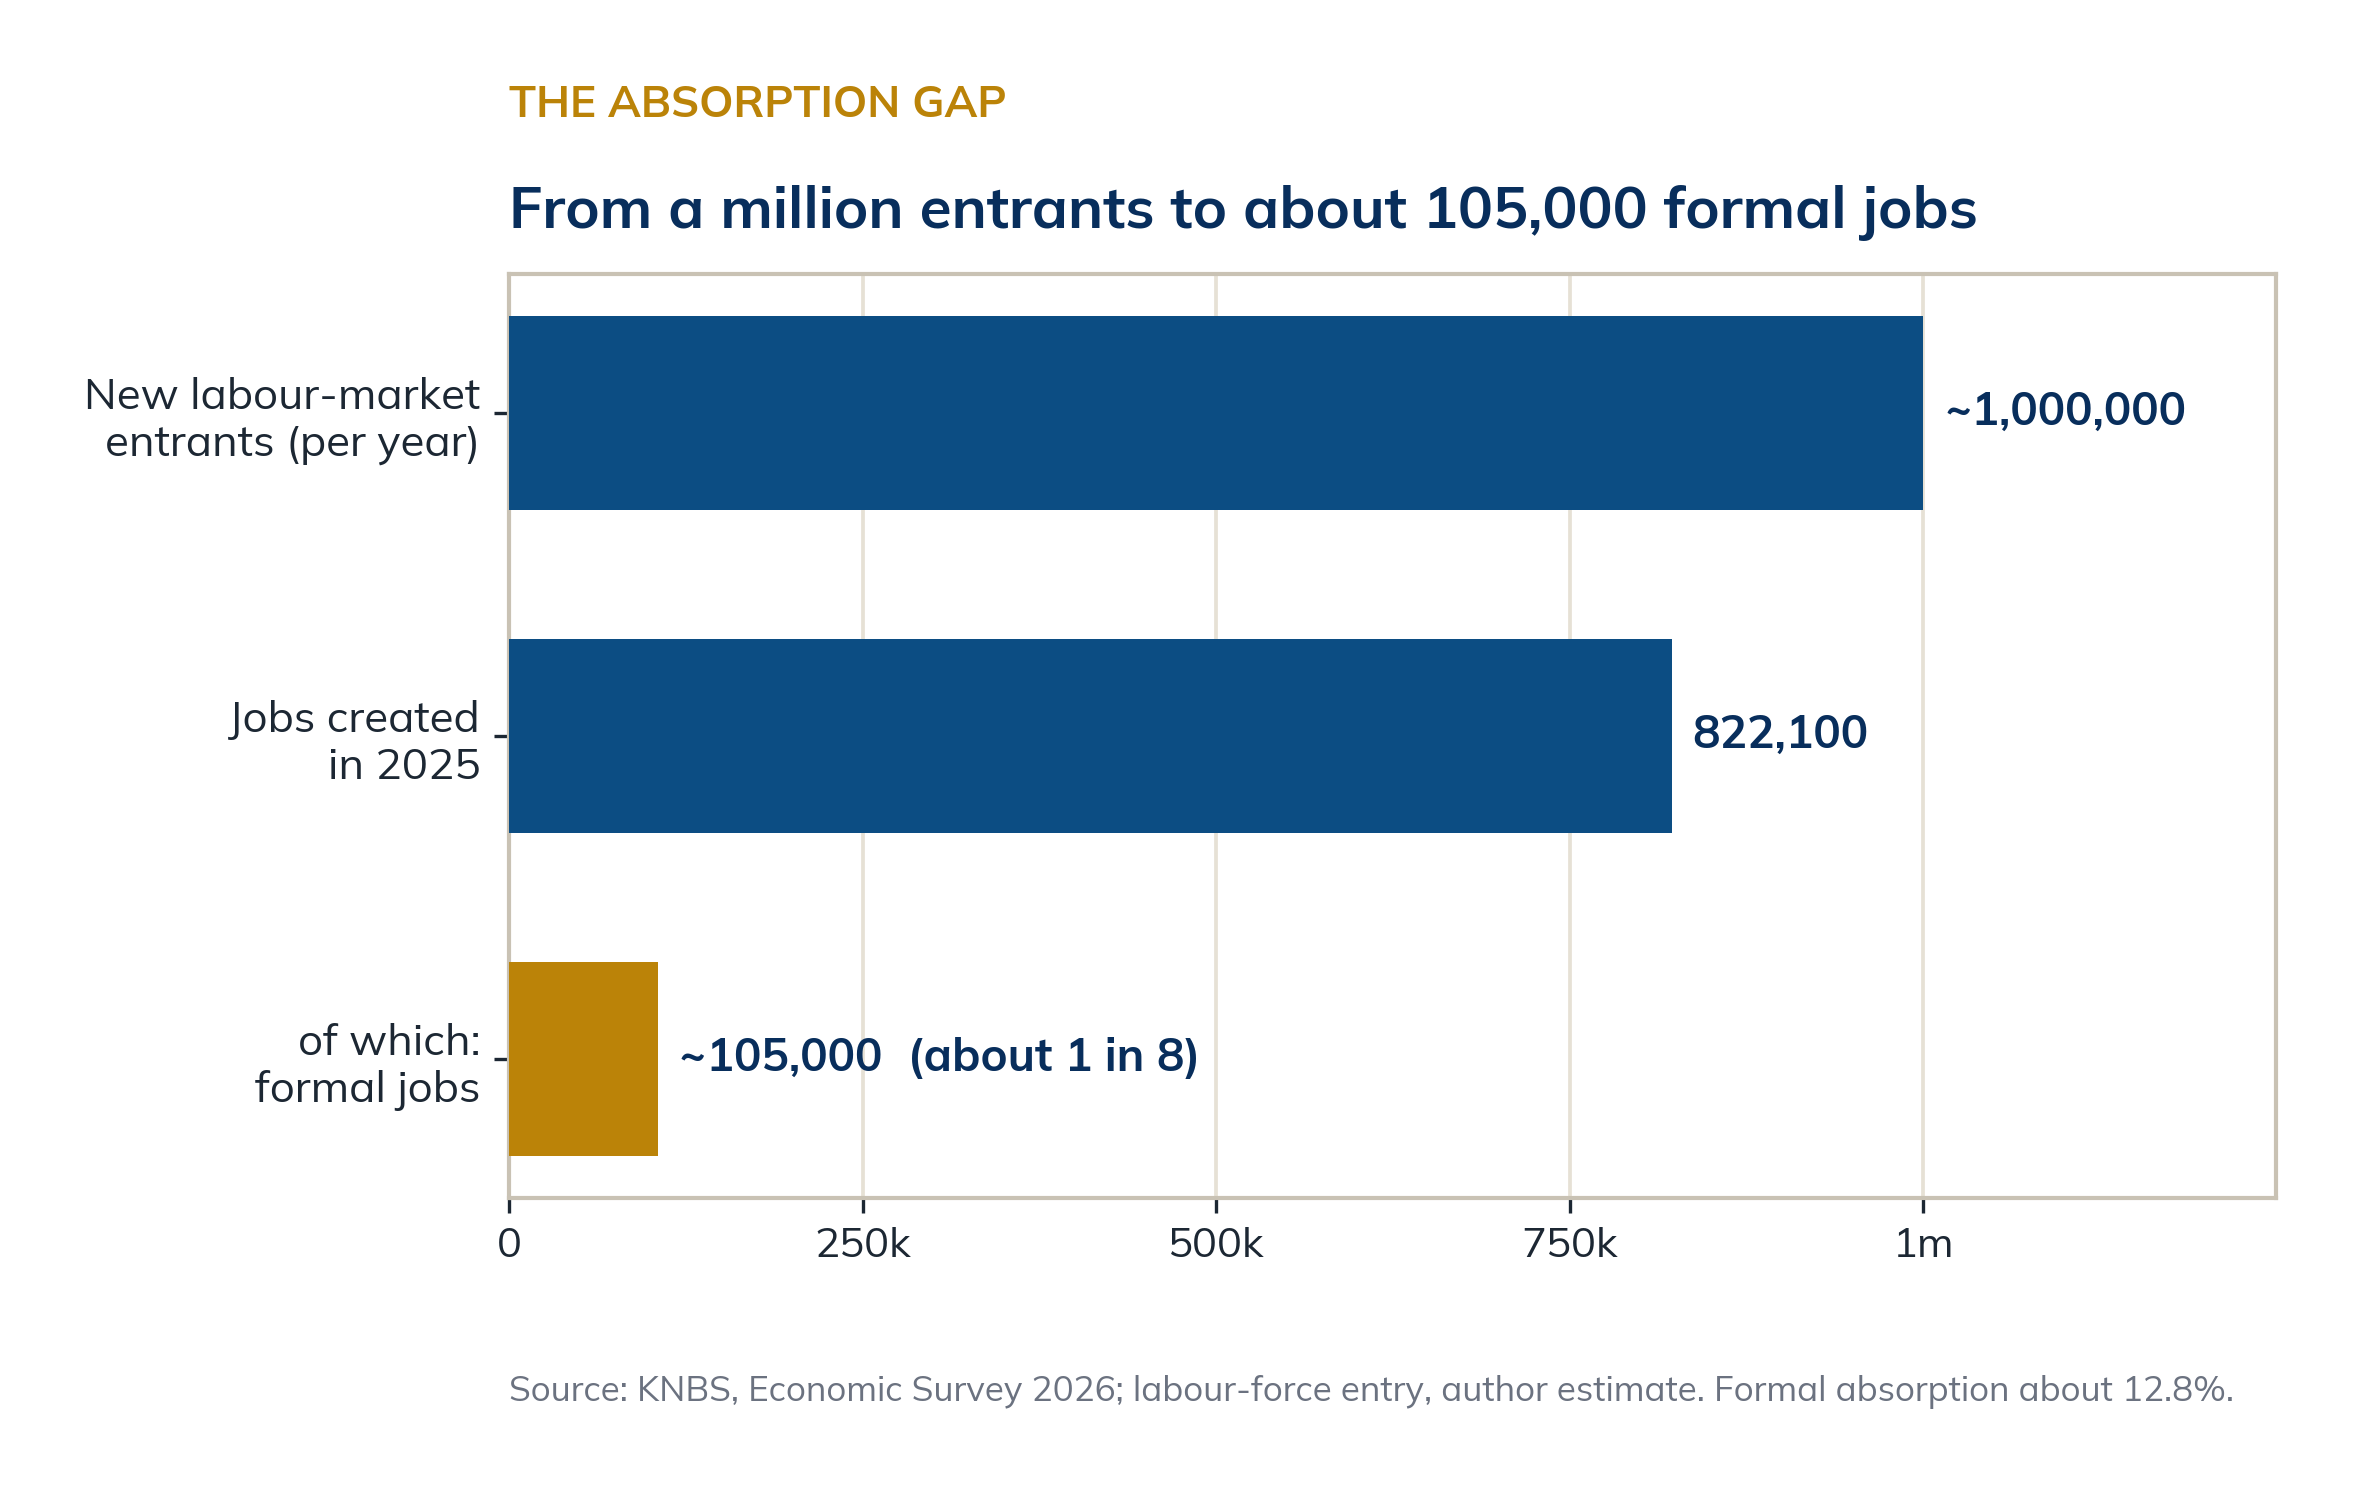
Kenya’s jobs funnel, 2025: from roughly a million entrants to about 105,000 formal jobs.
This is the heart of the matter. Growth that funnels new workers into low-productivity informal activity can look healthy in the national accounts while delivering little to families and even less to the state, which can tax only the formal base. Kenya does not need to grow faster so much as it needs its growth to mean more, to pull people up the ladder from informal hustle into formal, productive work. That, not the growth rate, is the test the next decade will set, and it is a deeply human one.
The factories that were promised never arrived
Why is the supply of good jobs so thin? Because the sector that historically manufactured them, literally, has been shrinking. Manufacturing accounts for just 7.1 percent of GDP, well below the 15 percent Vision 2030 set as its target, and in 2025 it grew only 2 percent, slower than the economy as a whole, so its share keeps slipping.23 The economist Dani Rodrik named this pattern premature deindustrialisation, the fate of economies whose factories peak early, at low incomes and at a fraction of the weight East Asia reached. South Korea and Taiwan let manufacturing climb past 25% of their economies before it receded; Vietnam and Bangladesh built booms by plugging into global supply chains. Kenya is shedding industrial weight before it ever truly industrialised. Agriculture, which still makes up 23.2 percent of GDP and a far larger share of jobs, remains mostly rain-fed, smallholder and low-value, with the processing that would lift its value largely missing. And because manufacturing and agro-industry are the escalator that carries workers from informal to formal jobs, an escalator with too few steps leaves most standing where they began.
The question that matters, though, is not whether Kenya should have more factories but whether it can make things the world will buy, and there part of the constraint is external. Global manufacturing has fragmented into value chains dominated by established Asian producers, Vietnam and Bangladesh among them, competing on a scale and logistics that a firm shipping through Mombasa, with its port delays, high inland transport costs and steep energy prices in several subsectors, struggles to match.24 Seen honestly, Kenya’s revealed strengths lie elsewhere. It is the world’s leading exporter of black tea, a major supplier of cut flowers to the European market and a competitive exporter of coffee and horticulture; its one real manufacturing-export success, apparel, was built almost entirely on the duty-free access of AGOA, which lifted Kenyan garment exports to the United States from about US$55 million in 2001 to US$603 million by 2022, roughly two-thirds of all it sold there, and which lapsed in 2025.25 The implication is not a generic call for factories but a sharper one. Kenya’s realistic industrial path runs through agro-processing, turning the tea, coffee, horticulture and dairy it already grows competitively into higher-value exports; through selective niches where it can meet world standards; and through the regional EAC and COMESA markets that already absorb much of its manufactures. The door to mass low-wage manufacturing that East Asia walked through is narrower now, and Kenya has to industrialise on the comparative advantages it actually holds.
Kenya is running a model built for a different country
Line Kenya up against the great growth stories of the past half-century and its identity comes into focus. The East Asian tigers grew on very high investment, manufactured exports and fast productivity catch-up. Vietnam and China grew by drawing in foreign investment that pulled local firms into global production. Ethiopia grew on state-led public investment driving farms toward factories, at the cost lately of a currency crisis. Mauritius prospered on finance, tourism and offshore services. Kenya fits none cleanly; it most resembles a services-and-consumption economy, cushioned by remittances and a deep home market, with a low investment rate and a receding industrial base.
Table 2. Five growth models, and where Kenya sits.
| Model | What drives it | Investment | Example |
|---|---|---|---|
| Export-industrial | Manufactured exports, high savings | 35-40% | South Korea, Taiwan |
| Value-chain / FDI | Foreign investment into global supply chains | 30-42% | Vietnam, China |
| State-led investment | Public investment, farms to factories | 28-35% | Ethiopia |
| Services hub | Finance, tech, tourism, offshore services | moderate | Mauritius |
| Services-consumption | Home services and consumption, remittances | 17.7% | Kenya |
Typology by the author; investment rates from World Bank data (approximate, recent years).
The comparison is a diagnosis, not a verdict. A services-led model is not inferior in principle; Mauritius built real prosperity on it. But Mauritius did so with strong institutions, high incomes and a small, ageing population, turning services into high value per worker. Kenya runs a services-led model at low income, with a young and fast-growing workforce that services alone cannot absorb into formal jobs, and an investment rate too low to lift the productivity that would raise wages. Kenya is, in short, running a model built for a richer, older, smaller country than the one it actually is. The answer is not to copy Seoul or Hanoi: those paths belong to other histories and other states. It is to build a Kenyan model, services strength fused with a revived productive and agro-industrial base, financed first by Kenyan savings, and fitted to a young, rural-and-urban, county-devolved society.
This is why the boom barely reaches the poor
A last tool asks who actually receives the growth.
METHODOLOGICAL BOX · WHO GETS THE GROWTH
%ΔPoverty = η · %ΔIncome
The fall in poverty equals income growth multiplied by η, the growth elasticity of poverty. The point: η is not fixed. Growth cuts poverty far less in an unequal society, because the gains pile up with those already above the line.
METHODOLOGICAL BOX · GROWTH OR DISTRIBUTION
ΔP = G + D + R
The change in poverty splits into a growth component (G), the effect of a rising average income at an unchanged distribution; a redistribution component (D), the effect of a changing distribution at an unchanged average; and a residual (R). Inclusive growth is simply growth in which G and D both push poverty down.
Read through that lens, Kenya’s record is legible. For two decades poverty fell on the strength of both components: average income rose, and the distribution narrowed, the Gini sliding from 46.5 in 2005 to 38.5 today. But each has lost force. The redistribution component is largely spent, since a Gini already moderate has little room left to fall, while the growth component, as the next lines show, has been weakened by the sectors that produced it.26 Future poverty reduction has to come from a growth component made stronger, growth that is labour-intensive, linked and spatially spread, rather than from squeezing an inequality that is no longer the binding problem. That is the analytical heart of inclusive growth for Kenya.
What keeps that elasticity low in Kenya is less the level of inequality, moderate by world standards and below Ghana or South Africa, than the composition of the growth itself. The sectors driving the expansion, financial and insurance services up 6.5 percent in 2025 and information and communication up 4.8 percent, alongside real estate, hospitality and mining, are capital and skill intensive, with thin links up and down to the mass of informal and rural workers. The sectors that actually employ Kenyans lag: agriculture, 23.2 percent of GDP but growing 3.1 percent, and manufacturing, the classic bridge from informal to formal work, growing 2 percent and now only 7.1 percent of output. Growth concentrated in high-productivity, low-linkage activity lifts the aggregate while bypassing the labour-intensive sectors that would carry it to the poor; the elasticity is low by construction, not merely by the Gini.27 The composition of growth, the cross-country evidence finds, matters for poverty as much as its pace: labour-intensive sectors such as agriculture and construction cut poverty more per point of growth than capital-intensive finance or extraction.28 L’Afrique des Idées’ own work on inclusive growth makes the same point at continental scale: where growth is broad and linked across sectors, poverty falls; where it is narrow, it does not.29
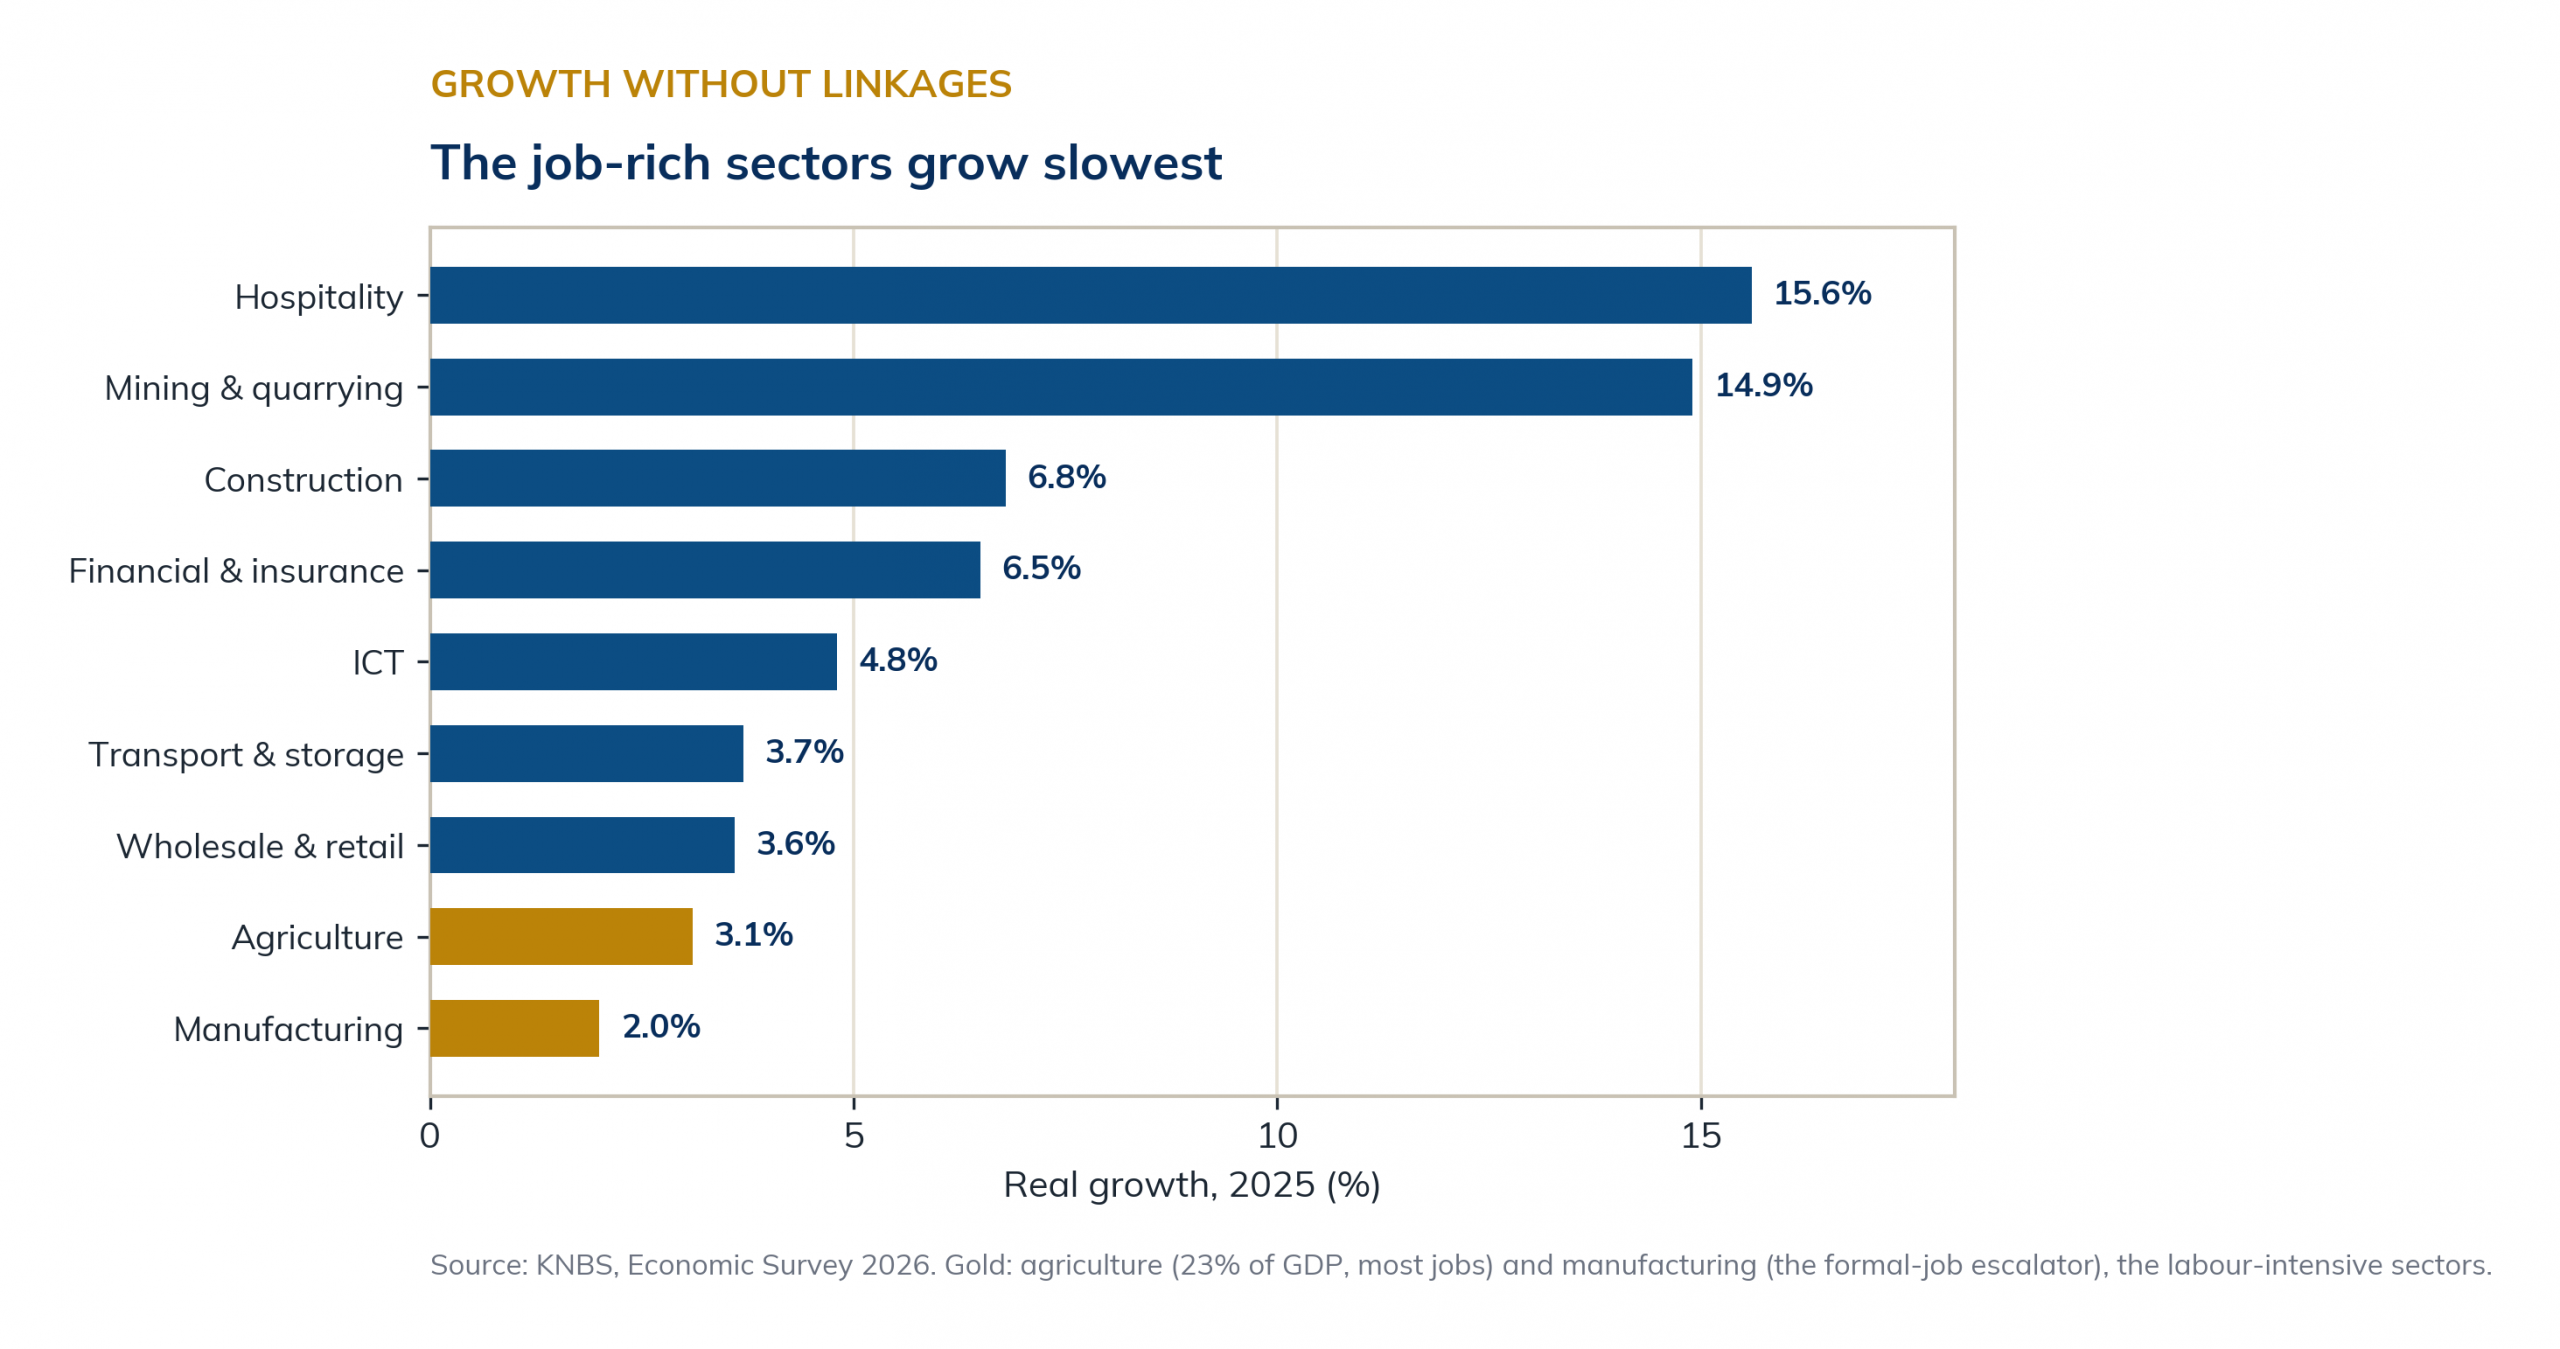
The composition of growth: the job-rich sectors grow slowest.
Here the two Kenyas come into full view. There is the Kenya of the data centre and the fintech founder, of regional headquarters and record capital, an African success the continent and the world have begun to notice. And there is the Kenya of the informal trader, the casual labourer and the jobless graduate. It is not only a divide of class but of geography, between a booming Nairobi and the arid counties of the north, between coast and highlands, a gap the devolution to 47 counties since 2010 was meant to close and has only begun to. In that other Kenya, 39.8 percent of people live below the poverty line. The inequality that matters here is less the national Gini, a moderate 38.5 by world standards and lower than it was twenty years ago, than its geography and its shape. Poverty runs from 16.5 percent in Nairobi to 82.7 percent in Turkana, a fivefold gap, and between those poles lies the whole country. The central highlands around Kiambu, Nyeri and Kirinyaga and the coastal hub of Mombasa all sit well below the national line; the western and Nyanza counties cluster near it; the Rift is uneven, Kericho jumping to 47.8 percent in a single year; and the arid north, Mandera, Samburu, Garissa, Tana River, Marsabit and Wajir, stands as a bloc above 64 percent.30 Underneath that map lies a second one, because poverty rates and population do not coincide. The largest numbers of poor Kenyans are spread across the populous counties: six of them, Nairobi, Kakamega, Bungoma, Nakuru, Kilifi and Turkana, hold about a quarter of all the poor between them, and rural Kenya carries 14.8 million of them against 5.4 million in the towns. The income that growth generates is concentrated too: the richest fifth of Kenyans take close to half of it, the poorest two-fifths about a seventh. Growth that pools in Nairobi and in the formal economy reaches that other Kenya, arid or rural, northern or simply crowded, only faintly; each point of national growth therefore buys less poverty reduction than the headline suggests, and the aggregate rises while the bottom waits. It is why years of respectable headline growth have coexisted with stubbornly high poverty. Consider the inflow that most flatters the macro picture: US$5.04 billion a year in remittances, the country’s largest single source of foreign exchange. That inflow is not idle money: it pays school fees and medical bills, which build human capital, and it seeds household savings and small-business capital, as the work on remittances and financial development finds. The weakness is one of intermediation: the money settles in consumption and housing rather than productive investment, and the instruments meant to convert it, the M-Akiba mobile bond, infrastructure and planned diaspora bonds, the Kenya Diaspora Investment Strategy 2025 to 2030, have so far underdelivered, M-Akiba in particular failing to draw subscribers. The binding constraint is the country’s financial structure, not the diaspora’s generosity.31 The question is whether the first Kenya pulls the second one up, or simply rises above it.
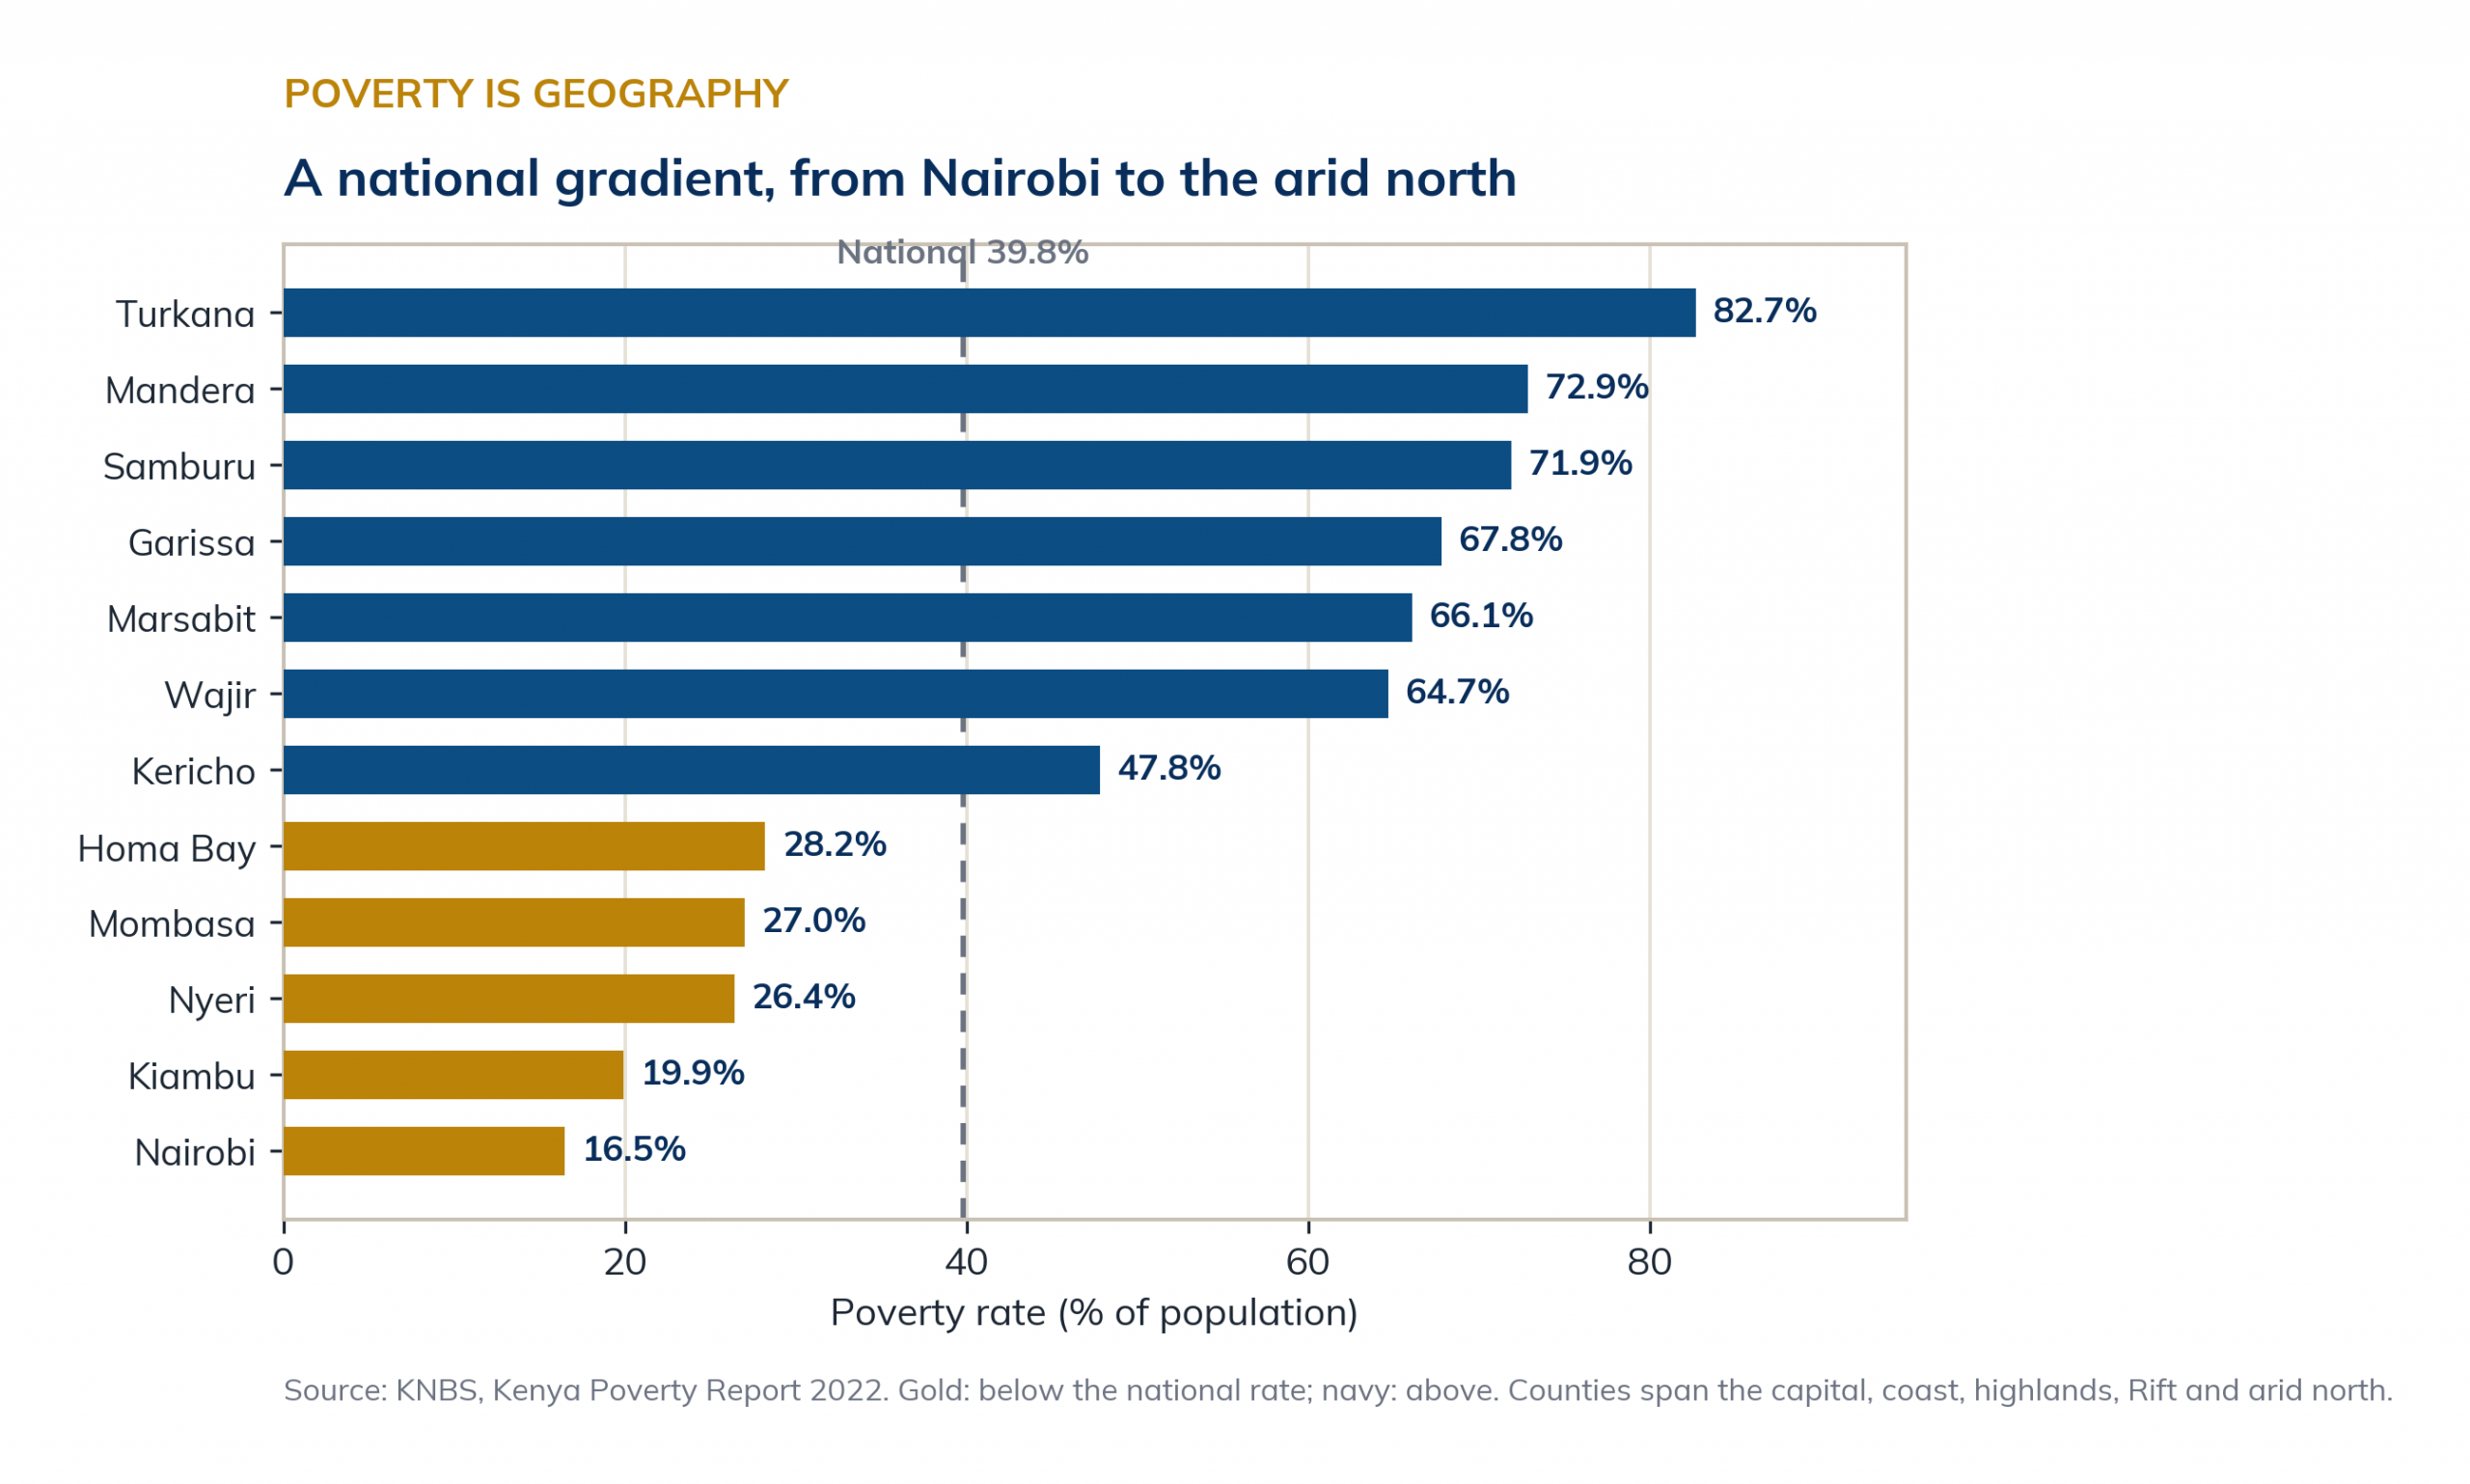
Poverty by county, 2022: Nairobi against the arid north.
The sharpest version of this divide is not between Nairobi and the north at all. It is inside Nairobi. The county with the lowest poverty rate in the country is, by consumption, its most unequal: a Gini of 40.9 in 2021, the highest of any county and above the national figure.32 The reason is visible from any flight path into the city. Around 60 percent of Nairobi’s residents, on the order of two million people, live in informal settlements that cover roughly 5 percent of its land; Kibera, Mathare, Mukuru and Korogocho sit within walking distance of the glass towers and gated suburbs that define the city abroad.
The gradient runs across the city’s own map. Poverty falls to 7.3 percent in Makadara and 12.7 percent in Langata and climbs to 26.3 percent in Kibra, and even those constituency averages flatter the settlements they contain. Nor is the gap only money. Barely 22 percent of slum households have a piped-water connection, and most buy from vendors at prices higher than wealthier neighbourhoods pay; childhood immunisation runs at 58 percent in the informal settlements against 73 percent across the city. The Royal Nairobi Golf Course shares a fence with Kibera; the lawns of Karen and Muthaiga are a short drive from Mathare. The two Kenyas are not only a matter of the distance between the capital and Turkana. They live on the same street. It is no accident that the revolt of June 2024 was young and urban: the city that concentrates the country’s wealth concentrates, just as sharply, the gap between those who share in it and those who serve it.
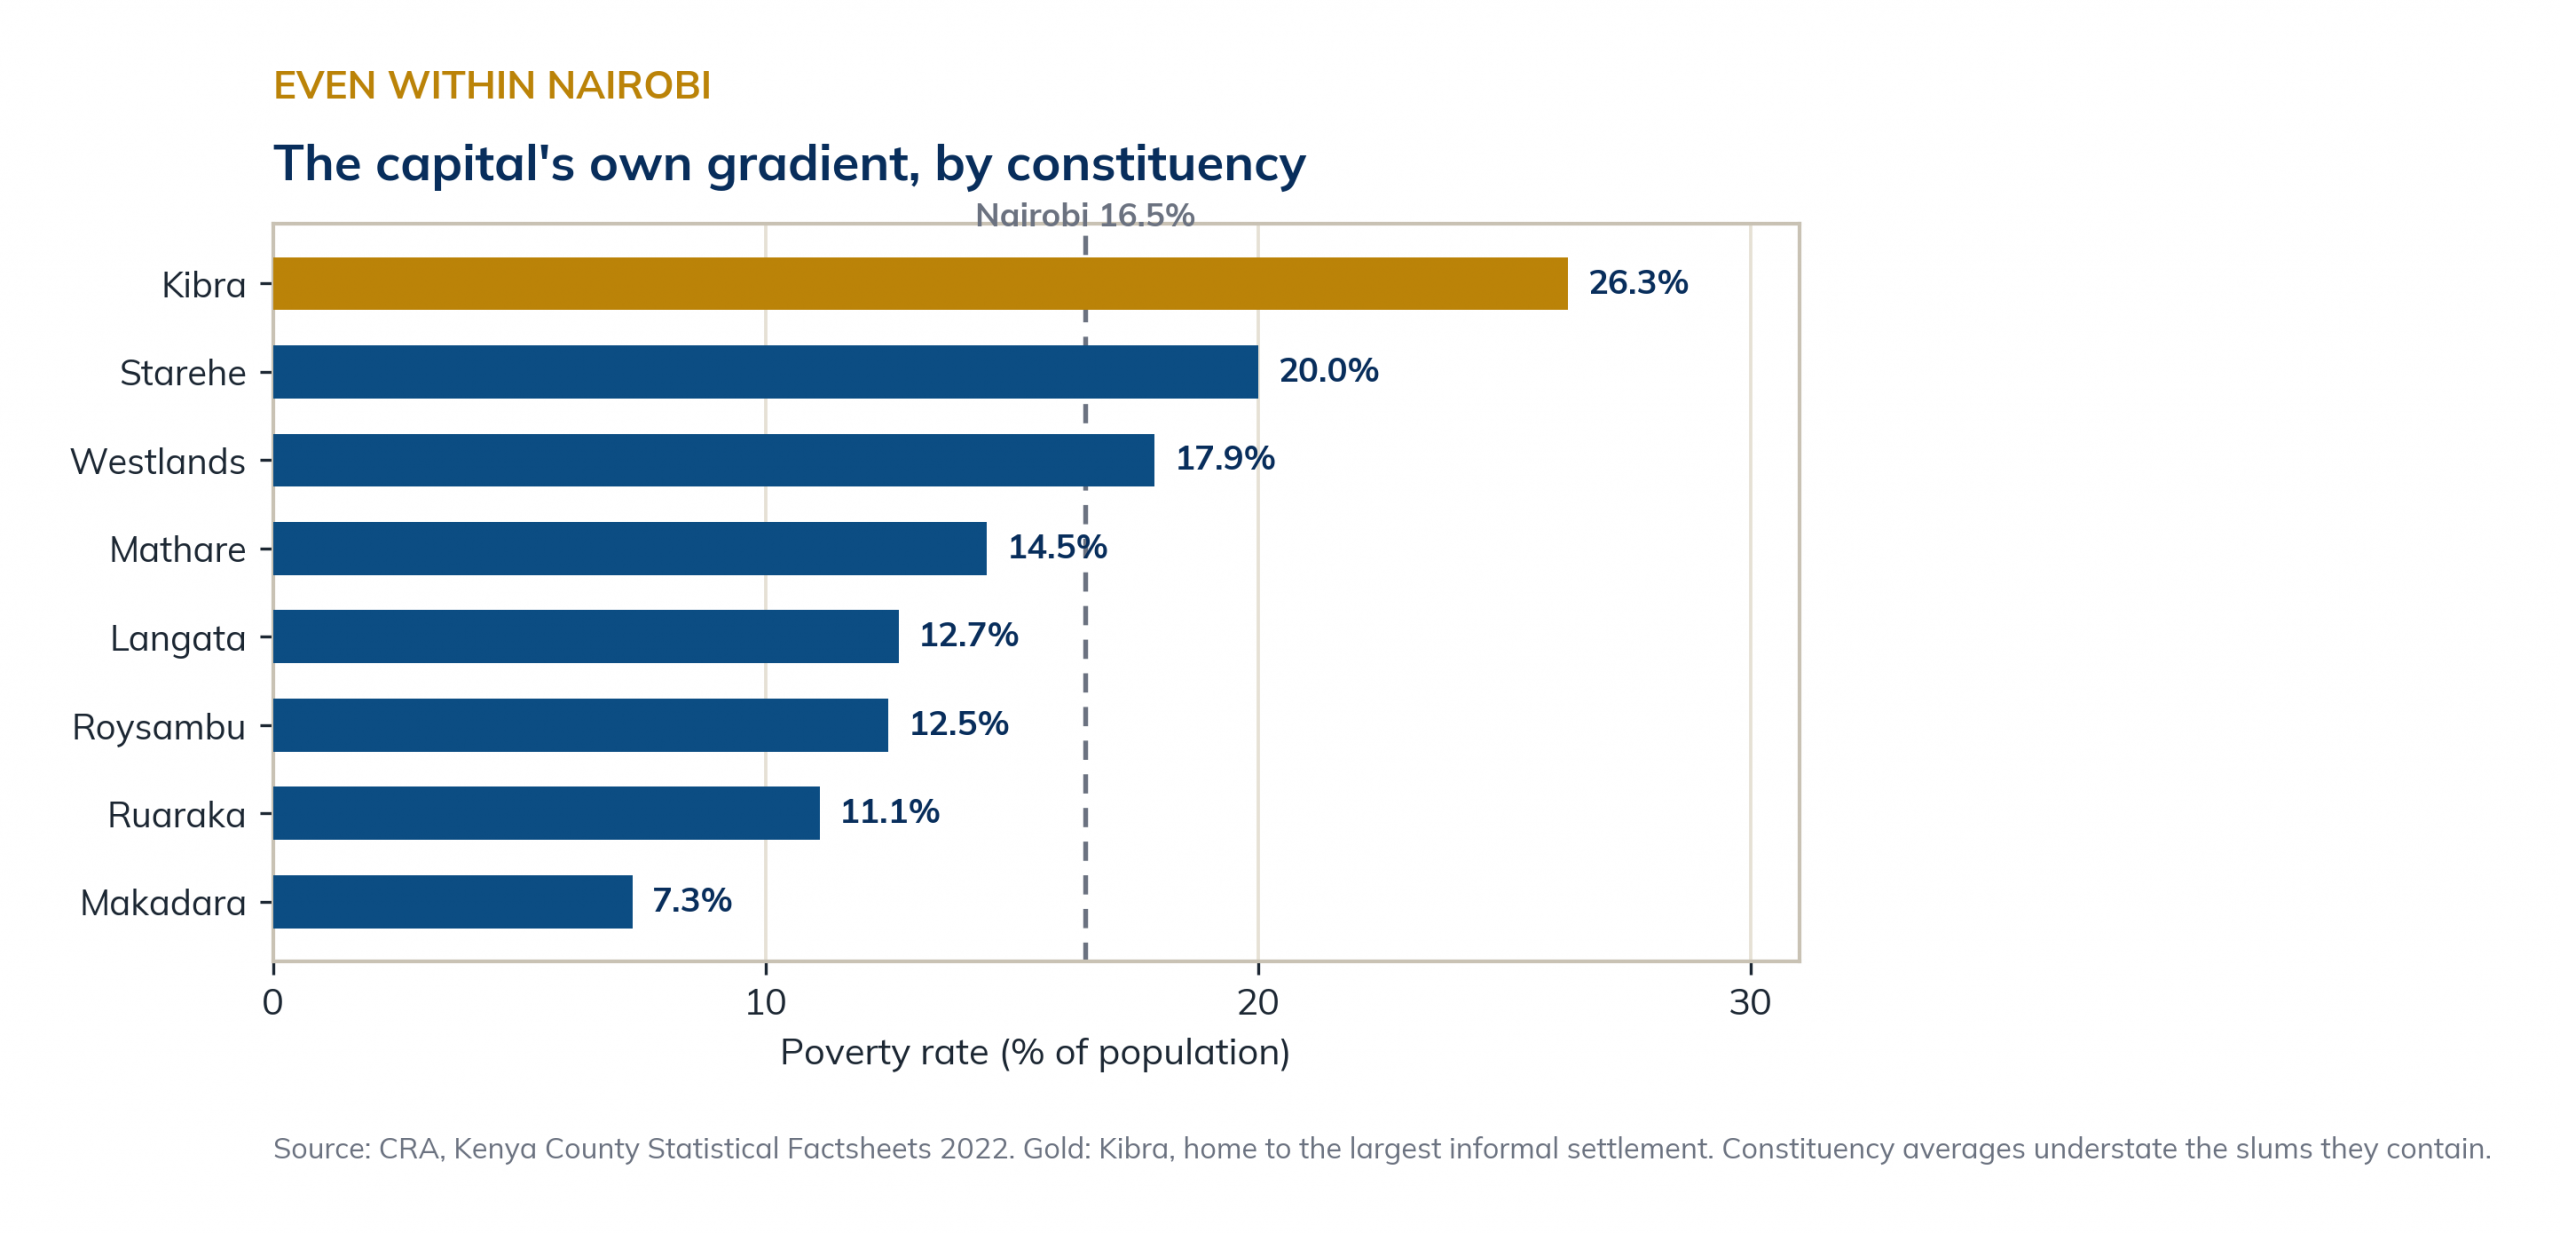
Within the capital: poverty by Nairobi constituency, 2022.
The summer the young refused to pay
In June 2024 that question stopped being abstract. When the government tried to close its budget gap with a finance bill stacked with new taxes, a leaderless generation organised on social media, took to the streets across the country and briefly stormed Parliament in Nairobi. Dozens were killed. The President withdrew the bill, and later let an IMF programme lapse.33 It was the most serious challenge to the state in a generation. Its grievances ran wider than tax, into corruption, police killings and the abductions that followed; but the economic core was unmistakable: a young, connected, taxpaying generation refusing to carry the cost of a model emerging without them. The episode carries a lesson no spreadsheet contains. Fiscal consolidation has a social limit, and a country whose public debt reached 67.8 percent of GDP by mid-2025, with the IMF projecting a climb toward 71.6 percent in 2026 and a high risk of distress, cannot simply tax its formal minority harder to escape the trap.34 Ordinary revenue is only about 14 percent of GDP, down from 18 percent a decade ago and far short of the 25 percent the East African Community treats as the mark, so a state this thin cannot both service its debt and build.35 The way out is not a heavier load on those already inside the net; it is to widen the net by formalising the economy, and to convert borrowing into the productive investment that pays for itself. That is an economic argument and, after June 2024, a political necessity.
What it would take for Kenya to grow differently
Four tools, one conclusion. Kenya’s growth is driven by piling on inputs rather than by rising productivity; it is capped by an investment rate that is too low; it creates jobs but overwhelmingly the wrong, informal kind; and it is shared through an unequal structure that dulls its effect on poverty. None of this denies the achievement, and the achievement is large. Kenya has the most diversified and most stable economy in its region, a payments revolution it gave the world, one of the cleanest power grids anywhere, a young population brimming with ambition, and a hard-won credibility its neighbours envy. This is not faint praise: it is precisely because Kenya is emerging for real that the shape of that emergence matters so much, for Kenyans and as a test the whole continent is watching.
Seen whole, these findings are not a list of complaints but a single system. Kenya grows by accumulation because it saves too little and taxes too thinly, and most of what it does raise is pre-empted by the service of its debt; it grows in the wrong sectors because the tradable, labour-intensive base that would lift both productivity and employment has thinned; and it grows in the wrong places because the gains pool in Nairobi and the formal economy. Each lock helps hold the others shut. Pull one alone and little moves; the levers have to turn together, which is the whole meaning of inclusive growth.
Table 3. The four gaps as one system: what keeps Kenya’s growth from reaching its people.
| The gap | What holds it shut | What turning it would reach |
|---|---|---|
| Accumulation | Savings near 13 percent and revenue near 14 percent of GDP, with debt service taking about 69 percent of revenue | Investment capacity, mobilised at home through SACCOs, remittances and a wider tax base |
| Efficiency | A capital-output ratio near 3.8, with capital aimed at non-tradables and consumption | More growth from each shilling, if allocation shifts toward tradables |
| Composition | Growth concentrated in low-linkage finance, ICT and mining, amid premature deindustrialisation | Jobs and a higher poverty elasticity, through agro-industry and labour-intensive tradables |
| Geography | Poverty of 16.5 percent in Nairobi against 82.7 percent in Turkana, and sharp divides inside Nairobi itself | The arid, rural and informal Kenya, through devolution-targeted investment |
Synthesis by the author. The fiscal lock, thin revenue and heavy debt service, runs across all four gaps.
Growing differently means four concrete things. Lift productivity, not just inputs, through skills, technology and the efficiency of firms. Raise the investment rate and aim it at tradable, productive capacity rather than consumption. Build the industrial base Kenya can actually compete on, agro-processing first and selective niches, the kind that turns informal workers into formal ones, rather than chase a mass-manufacturing model the world market no longer offers on the old terms. And pursue a pattern of growth whose gains actually reach the 4 in 10 still below the poverty line. That is not a call to grow faster. It is a call to grow better, and to grow together. Kenya has already won the contest of size, though that victory should be read with care: it holds at market exchange rates, while at purchasing-power parity Ethiopia, with more than twice the population, remains the larger economy. The harder contest is only beginning, and this first analysis has done no more than open it. Having grown this much, Kenya now faces the question its own streets put in June 2024: for whom does it grow next?
Table 4. Kenya and its East African neighbours, 2024-2025.
| Indicator | Kenya | Tanzania | Uganda | Rwanda | Ethiopia |
|---|---|---|---|---|---|
| GDP, US$ bn (2025) | 136 | 87 | 64 | 15 | 109 |
| Real growth 2024 | 4.7% | 5.6% | 6.1% | 8.9% | 8.1% |
| Real growth 2025 | 4.6% | 6.0% | 6.4% | 7.5% | 9.8% |
GDP at current prices, IMF and Statista, 2025. Real GDP growth: KNBS, Economic Survey 2026 (Kenya), and African Development Bank, MEO 2026.
References
Adams and Page (2005). Do International Migration and Remittances Reduce Poverty in Developing Countries? World Development.
Amsden (1989). Asia’s Next Giant.
Datt and Ravallion (1992). Growth and Redistribution Components of Changes in Poverty Measures. Journal of Development Economics.
Easterly and Levine (2001). It’s Not Factor Accumulation. World Bank Economic Review.
Feenstra, Inklaar and Timmer (2015). Penn World Table.
Houngbonon and others (2013, 2014). Inclusive growth in Africa. L’Afrique des Idées; presented at UNU-WIDER (Helsinki, 2013) and the World Bank Annual Bank Conference on Africa (Paris, 2014).
Krugman (1994). The Myth of Asia’s Miracle. Foreign Affairs.
Loayza and Raddatz (2010). The Composition of Growth Matters for Poverty Alleviation. Journal of Development Economics.
McKinnon (1973). Money and Capital in Economic Development. Brookings Institution.
Rodrik (2016). Premature Deindustrialization. Journal of Economic Growth.
Shaw (1973). Financial Deepening in Economic Development. Oxford University Press.
Solow (1957). Technical Change and the Aggregate Production Function. Review of Economics and Statistics.
Studwell (2013). How Asia Works.
Young (1995). The Tyranny of Numbers. Quarterly Journal of Economics.
Notes
[1] Communications Authority of Kenya, Sector Statistics, June 2025; 76.7 million active SIM lines, penetration 146.3 percent. ↩
[2] Communications Authority of Kenya and Central Bank of Kenya, 2025; 47.7 million active mobile-money accounts, M-Pesa 91 percent of the market. ↩
[3] KNBS, Economic Survey 2026; informal work about 85 percent of total employment, 87.2 percent of jobs created in 2025. ↩
[4] IMF and Statista, 2025; Kenya nominal GDP about US$136 bn (KES 17.58 trillion, KNBS) against Ethiopia about US$109 bn, whose dollar GDP fell after the July 2024 birr float (depreciation above 55 percent, World Bank). ↩
[5] Launch Base Africa and industry trackers, 2024-2025; Kenya among the continent’s top destinations for startup capital, close to US$1 bn in 2025; rankings vary by tracker and year. ↩
[6] EPRA, Energy and Petroleum Statistics, year to June 2025; renewables 80.2 percent of electricity, geothermal 39.5 percent. ↩
[7] Central Bank of Kenya, 2025; diaspora remittances US$5.04 bn, up 1.9 percent, the single largest source of foreign exchange. ↩
[8] KNBS 2019 census projections and World Bank; about 75 percent of Kenyans under 35, population about 56 million. ↩
[9] African Development Bank, MEO 2026, and Table 4; among its major neighbours Kenya recorded the lowest 2025 growth. ↩
[10] KNBS, Kenya Poverty Report 2022; poverty headcount 39.8 percent, Gini 38.5. ↩
[11] Company announcements and press reports, 2024; Microsoft and G42 geothermal-powered data centre, the largest private digital investment in Kenya’s history. ↩
[12] Kenya Flower Council and EU trade data; Kenya among the world’s leading cut-flower exporters. ↩
[13] KNBS, Economic Survey 2026; real growth 5.7 percent (2023), 4.7 percent (2024), 4.6 percent (2025). ↩
[14] African Development Bank, MEO 2026; East Africa growth 6.4 percent in 2025. ↩
[15] KNBS and Central Bank of Kenya, 2025-2026; inflation averaged 3.8 percent in 2025, rising to 5.6 percent by April 2026; reserves US$13.24 bn, 5.6 months of import cover (June 2026). ↩
[16] Growth accounting follows Solow (1957). On the residual, rather than accumulation, driving most cross-country income gaps, Easterly and Levine (2001); the accumulationist counterpoint, Young (1995) and Krugman (1994). Measured productivity is sensitive to capital-stock and depreciation assumptions (Feenstra, Inklaar and Timmer, 2015). ↩
[17] Growth-accounting studies of Kenya (Solow and Cobb-Douglas framework), from the 1970s to recent work, with AfDB and KIPPRA productivity analyses; total factor productivity found weak, volatile and in several periods negative. ↩
[18] World Bank, gross fixed capital formation (% of GDP); Kenya 17.7 percent in 2024; high-growth comparators shown at their take-off decades. ↩
[19] World Bank, gross domestic savings about 13 percent of GDP (2024); SASRA, SACCO Supervision Report 2024, regulated SACCO assets KES 1.076 trillion, 7.39 million members. ↩
[20] On savings mobilisation through financial repression and directed credit in the East Asian model, McKinnon (1973) and Shaw (1973); Amsden (1989); Studwell (2013). ↩
[21] National Treasury and Controller of Budget, FY2024/25; debt service about 69 percent of ordinary revenue (KES 1.72 trillion) against the IMF threshold of 30 percent; interest payments up from 18 to 25 percent of public spending in four years. ↩
[22] KNBS, Economic Survey 2026; 822,100 jobs created in 2025, 716,800 informal (87.2 percent), wage employment 15.3 percent of 21.6 million, real-wage index 85.84 (2009=100). ↩
[23] KNBS, Economic Survey 2026, and Kenya VNR 2024; manufacturing 7.1 percent of GDP in 2025, down from 11.5 percent in 2009, growth of 2 percent, against the Vision 2030 target of 15 percent. ↩
[24] Kenya Association of Manufacturers, Exports Competitiveness Study, 2025, estimating about KES 684 billion in untapped export potential and flagging Mombasa-corridor logistics and energy costs; on premature deindustrialisation as a global-trade phenomenon, Rodrik (2016). ↩
[25] Apparel exports to the United States rose from about US$55 million in 2001 to US$603 million in 2022, roughly two-thirds of Kenya’s US exports, under AGOA, which lapsed in 2025 (US International Trade Commission; KNBS). Tea and cut-flower standing: International Trade Centre and Kenya Flower Council. ↩
[26] Decomposition following Datt and Ravallion (1992). The Gini fell from 46.5 (2005) to 38.5 (2022): World Bank Poverty and Inequality Platform and KNBS. ↩
[27] KNBS, Economic Survey 2026: 2025 real growth, financial and insurance 6.5 percent and information and communication 4.8 percent, against agriculture 3.1 percent and manufacturing 2.0 percent; manufacturing 7.1 percent of GDP in 2025, down from 11.5 percent in 2009. ↩
[28] On the composition of growth and poverty, Loayza and Raddatz (2010). ↩
[29] L’Afrique des Idées study on inclusive growth in Africa, Houngbonon and others (2013, 2014). ↩
[30] KNBS, Kenya Poverty Report 2022: poverty 16.5 percent in Nairobi, 19.9 percent in Kiambu, 27.0 percent in Mombasa, 28.2 percent in Homa Bay, 47.8 percent in Kericho, up to 82.7 percent in Turkana; six populous counties (Nairobi, Kakamega, Bungoma, Nakuru, Kilifi, Turkana) hold about a quarter of all poor Kenyans; rural poor 14.8 million against 5.4 million urban. Income shares, World Bank Poverty and Inequality Platform: top quintile about 48 percent, bottom 40 percent about 14 percent. ↩
[31] On remittances and poverty, Adams and Page (2005); on the Kenyan link between remittances and financial development, a 2019 study in Financial Innovation. M-Akiba, the first mobile-phone bond, drew low subscription; the Kenya Diaspora Investment Strategy 2025-2030 shifts the aim from remittances to investment. ↩
[32] Nairobi consumption Gini 40.9, the highest of any county (KNBS, KCHS 2021), above the national 38.5; UN-Habitat and KENSUP, about 60 percent of Nairobi residents in informal settlements on roughly 5 percent of the land, 22 percent of slum households with a piped-water connection; Amnesty International 2019, about 2 million residents in informal settlements; constituency poverty, CRA Kenya County Statistical Factsheets 2022 (Makadara 7.3, Langata 12.7, Kibra 26.3); immunisation 58 against 73 percent, Nairobi Cross-Sectional Slum Survey 2012, APHRC. ↩
[33] Press reports, June 2024; withdrawal of the Finance Bill after nationwide protests, and the subsequent lapse of the IMF programme. ↩
[34] National Treasury, Annual Public Debt Report 2024/25; public debt 67.8 percent of GDP at end-June 2025; IMF April 2026 REO projects 71.6 percent in 2026; high risk of distress. ↩
[35] National Treasury, Medium Term Revenue Strategy: ordinary revenue fell from 18.1 percent of GDP (FY2013/14) to 14.1 percent (FY2022/23); the East African Community target is 25 percent, sought by 2030. ↩