

Kenya has built one of the most admired private sectors in Africa, and cannot make it work for most Kenyans. The country counts about 7.4 million enterprises and a handful of firms that rank among the best run on the continent; its banks hold a record 4.1 trillion shillings of private credit, and its founders raised about 1.04 billion dollars in 2025, more than any other African country. Formal financial access has climbed to 84.8 percent of adults, from 26.7 percent in 2006. On paper, few economies in the region start from a stronger base. In practice, that base does not produce what the country most needs: of the 822,100 jobs created in 2025, 87 percent were informal, and manufacturing has slipped to 7.1 percent of GDP. The scaffolding is world-class; formal, productive, decently paid work at scale is not.
The distance between the two is the subject of this note. It is not explained by a lazy state or an absent market. It is explained by where money goes when an economy is left to its own incentives. In Kenya those incentives pull capital toward the government and toward consumption, and away from the factories, farms and value chains that would turn a young population into a workforce. The capital exists and flows to the wrong place. The entrepreneurs exist and stay small. The champions exist and cluster in finance, telecoms and consumer goods.
Who builds Kenya’s growth, and what stops them from building more, is therefore not an academic question. It decides whether the youngest, fastest-urbanising region on earth, where about 800,000 Kenyans reach working age each year, converts its demography into prosperity or into pressure. Kenya is the case its neighbours study, because it has gone further than almost any of them in assembling the pieces, finance, infrastructure, law and talent, and still finds them not adding up.
This note follows that arithmetic from the ground up: how the private economy was built, what carries it and what holds it back, where the money actually goes, and what the region’s faster industrialisers did differently. The argument is simple. The repair is largely within Kenya’s own hands, and a stronger, broader private sector, not another transfer programme, is the surest route to growth that reaches the many.
Where the private economy came from
The startup scene and the champions that make Kenya’s private sector the envy of the region did not appear on their own. They are the product of an environment that was built, dismantled and rebuilt across four cycles of governance, and most of what matters was decided after 2000. To understand why capital behaves as it does today, it helps to see how the country arrived here.
At independence in 1963, Jomo Kenyatta’s government set out a mixed model in the Sessional Paper of 1965 on African socialism, drafted by Tom Mboya and a young Mwai Kibaki. It combined import-substituting industry behind tariffs with support for smallholder agriculture and open incentives for private, often foreign, investment. It worked, for a while: real output grew by an average of 6.6 percent a year between 1963 and 1973, the strongest run of any Kenyan presidency.1 By the late 1970s the formula had run its course, capital-hungry, poor at creating jobs and dependent on the very imports it was meant to replace.
The Moi years, from 1978 to 2002, were the long stall. State intrusion deepened, the financial system was repressed, and governance frayed. The low point came between 1991 and 1993, the worst stretch since independence, when inflation touched 100 percent, the fiscal deficit passed 10 percent of GDP and donors suspended aid. The liberalisation that began in 1993, lifting price, import and foreign-exchange controls and privatising state firms, was forced by crisis rather than chosen, but it laid the first stone of a genuine private-sector economy. Growth across the Moi era still averaged below 3 percent.1
The decade that built today’s environment was Mwai Kibaki’s. The Economic Recovery Strategy of 2003 to 2007 lifted growth from 0.6 percent in 2002 to between 5 and 7 percent by 2007; free primary education arrived in 2003; and Vision 2030, launched in 2008, made a private-sector-led economy the country’s explicit long-term goal.2 The single most consequential event was quieter: in 2007 Safaricom launched M-Pesa, and mobile money began to rewire Kenyan finance from the bottom up. The investor pipeline, the Silicon Savannah idea and the dense banking fabric the country is known for were, in large part, built in these years.
The cycles since have consolidated that inheritance and added a bill. Devolution in 2013 pushed resources to 47 new county governments; the state borrowed heavily to build roads, rail and power; Kenya crossed into lower-middle-income status in 2014 and its income per head passed 2,000 dollars by the mid-2020s. But growth settled at around 5 percent, and the public borrowing of this period is the crowding-out this note anatomises.2
Sixty years in four cycles
| Governance cycle | Economic model | Growth | Turning point for the private sector |
|---|---|---|---|
| Kenyatta (1963 to 1978) | African socialism, import substitution, smallholder farming | 6.6% a year, 1963-73 | Fastest growth of any era, but the model exhausts itself by the late 1970s |
| Moi (1978 to 2002) | State intrusion, financial repression, then forced liberalisation | below 3% average | The 1993 reforms remove price, import and forex controls: the first opening |
| Kibaki (2002 to 2013) | Recovery strategy, macro stability, Vision 2030 | 0.6% (2002) to 5-7% (2007) | The favourable environment is built: M-Pesa in 2007, a private-sector-led Vision 2030 |
| Kenyatta II and Ruto (2013 to date) | Infrastructure, devolution, fiscal strain | around 5% | Middle-income status in 2014; a dense banking fabric, but rising debt and crowding-out |
Sources: World Bank and KNBS long-run series; Republic of Kenya, Sessional Paper No. 10 of 1965 and Vision 2030; period averages are approximate.
The most durable legacy of that long arc is the financial system. Formal financial access rose from 26.7 percent of adults in 2006 to 84.8 percent in 2024, one of the fastest episodes of financial deepening recorded anywhere, carried by mobile money and by agency banking that put a bank counter in every shopping centre.3
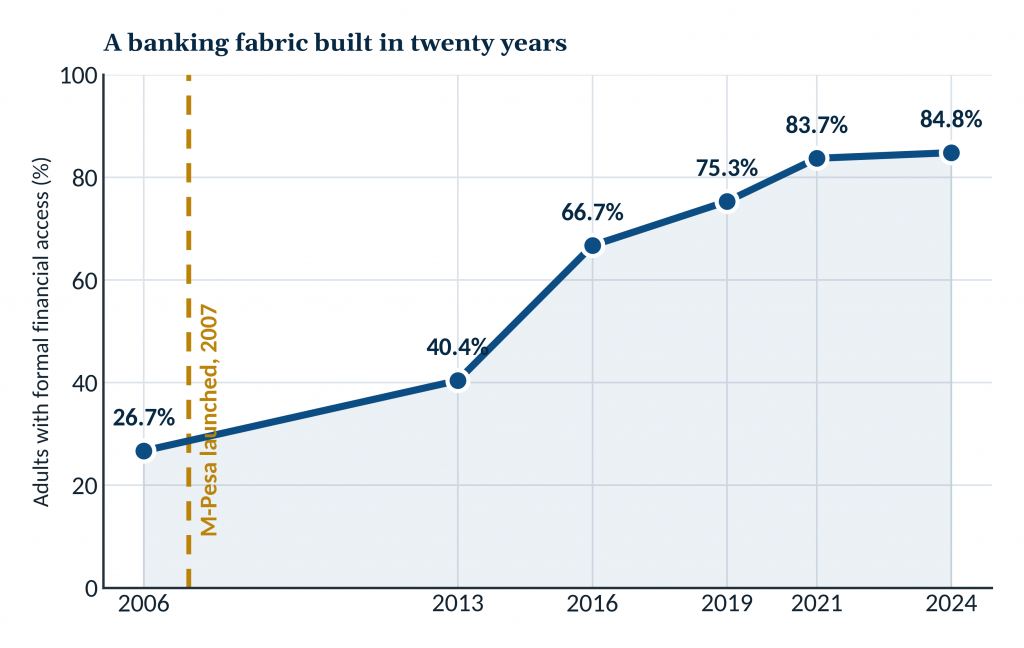 Chart 1. Adults with formal financial access, 2006 to 2024. Source: FinAccess Household Surveys (CBK, KNBS and FSD Kenya).
Behind that headline sits real institutional density. Kenya is served by 38 commercial banks in three tiers, 14 microfinance banks, a fast-growing field of 85 licensed digital credit providers, a mortgage finance company and a mortgage refinance company, alongside a large cooperative tier of SACCOs regulated separately from the banks. The map below sets out the architecture.3
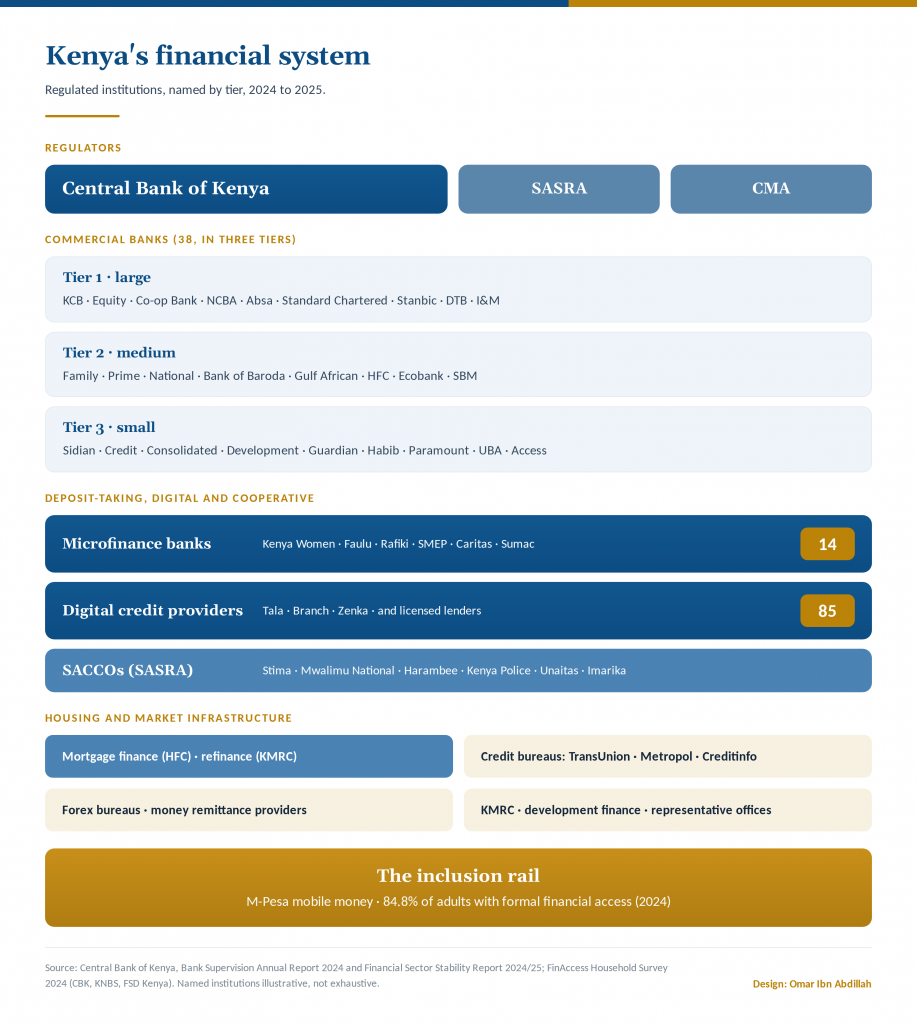 Figure 1. Kenya’s financial system: regulated institutions and the inclusion rail. Source: Central Bank of Kenya, Bank Supervision Annual Report 2024.
The scaffolding: infrastructure and law
A private sector needs more than banks. It needs roads to move goods, power to run machines, ports to reach markets, and a body of law that lets a firm incorporate, borrow against its assets, enforce a contract and, if it fails, close without ruin. Kenya has spent two decades building both, unevenly, and the result is the second half of the environment these pages describe.
The physical spine is visible. The Standard Gauge Railway cut cargo time from Mombasa to Nairobi from about two days to eight hours; the Nairobi Expressway, the first Kenyan toll road run by a private operator, turned a two-hour crawl into a fifteen-minute run and carries some 50,000 vehicles a day; the LAPSSET corridor, at a headline 24 billion dollars, is opening a northern route to Ethiopia and South Sudan; and Konza Technopolis is meant to anchor the digital economy.
Export processing and special economic zones, which by the end of 2022 counted 101 zones, 170 firms and about 75,600 workers, give manufacturers serviced land and multi-year tax relief. The pipeline the state runs through its Public Private Partnership Directorate reached 40 projects at the start of 2026.4
Infrastructure that carries the private sector
| Project | Type | Status and year | Effect on the private sector |
|---|---|---|---|
| Standard Gauge Railway | Rail, state | Phase 1 opened 2017; Naivasha 2019 | Cargo time to about 8 hours; lower logistics cost |
| Nairobi Expressway | Toll road, PPP | Opened 2022; 27 km | First private-run toll road; about 50,000 vehicles a day |
| LAPSSET corridor | Port, corridor | Launched 2012; 3 of 32 berths by 2021 | Northern trade route to Ethiopia and South Sudan |
| Konza Technopolis | Tech city, SEZ | Since 2013; data centre from 2024 | Digital-economy hub; targets ICT firms and jobs |
| SEZs and parks | Serviced land | SEZ Act 2015; parks operating | Land, power and tax incentives for manufacturers |
| Menengai geothermal | Power, IPPs | Commissioned 2023 to 2024; 105 MW | Cheaper, cleaner power for industry |
Sources: InvestKenya; PPP Directorate (2026); Vision 2030 Delivery Secretariat; US country commercial guide.
The legal architecture matters as much as the concrete. Over a single decade Kenya rewrote the rules that govern how a business is born, financed and, if it must, wound down. A firm can now incorporate online, pledge its stock or equipment rather than only its land to raise a loan, restructure under a moratorium instead of collapsing into liquidation, and sign a contract with an electronic signature.4
The legal architecture of enterprise
| Reform | Year | What it changed for firms |
|---|---|---|
| Companies Act; Insolvency Act | 2015 | Modern incorporation and governance; rescue and moratorium procedures instead of automatic liquidation |
| Special Economic Zones Act | 2015 | A zone regime with multi-year tax incentives, capped at ten years since 2024 |
| Movable Property Security Rights Act | 2017 | Lets firms borrow against movable assets, not only land, through a collateral registry |
| Data Protection Act | 2019 | A data-governance framework for the digital economy |
| Public Private Partnership Act | 2021 | A framework and Letter of Support for private investment in infrastructure |
| Business Laws (Amendment) Acts | 2020 to 2024 | Electronic signatures and digital contracts; Central Bank oversight of digital lenders |
| Startup Bill | before Parliament, 2022 | Would create the first legal framework for startups: registration, incubation and support |
Sources: Kenya Law (statutes); EY tax alerts; US State Department, 2025 Investment Climate Statement.
The scaffolding is real, and more complete than in most of the region. Its weaknesses are just as real. The infrastructure was financed largely by external debt, which is the crowding-out these pages trace. The incentives shift with each Finance Act, so firms cannot plan five years ahead. And the one reform aimed squarely at young enterprise, the Startup Bill, has sat before Parliament since 2022 without passing, while the headline goal of 10 billion dollars in annual foreign investment by 2027 remains far from the trend.4 Kenya has built the hardware and much of the software of a private economy.
What it has not yet built is the predictability that lets firms trust either.
Finance, infrastructure and law: Kenya has assembled more of the scaffolding of a private economy than any of its neighbours. The puzzle these pages pursue is why, with all of it in place, capital still flows away from the firms that would make growth reach the many. It begins with the shape of those firms.
An economy of many hands and very few firms
Start with the raw shape of Kenyan enterprise. The country counts roughly 7.4 million micro, small and medium enterprises. Of these, about 1.56 million are formal and 5.84 million are informal, and together they employ close to 15 million people and are estimated to generate around 40 percent of GDP.5 Nearly four in five of these businesses operate with no registration and no licence.
Small and medium firms make up more than 90 percent of all businesses in Kenya and account for about 81 percent of employment.6 The count itself understates the informal reality: the State Department for MSME Development puts the true number nearer 18 million once unregistered units are included.
That is extraordinary entrepreneurial density. It is also the problem. The overwhelming majority of these enterprises are micro units of survival, a stall in Gikomba, a boda boda, a welder, a single-person agribusiness. They are not small firms on their way to becoming medium ones. They are the terminus, not the on-ramp.
The 2016 enterprise survey found that more than 80 percent of MSME start-ups relied on family or personal savings for their capital, because the formal financial system was not built to reach them.5 An economy with 5.84 million informal firms and only 1.56 million formal ones does not have a small-business sector in the sense that word carries in a diversified economy.
It has a vast informal periphery and a thin formal core.
THE FORMALISATION DEFICIT
f = formal ÷ total = 1.56 m ÷ 7.4 m ≈ 21%
Only about one Kenyan enterprise in five is formal. The other four sit outside the credit, contract and export systems that let firms grow.
The shape of Kenyan enterprise
| Segment | Scale | Employment / weight |
|---|---|---|
| MSMEs, total | ~7.4 million | ~14.9 million jobs; ~40% of GDP (est.) |
| of which formal | 1.56 million | |
| of which informal | 5.84 million | ~79% of all MSMEs |
| SMEs, share of all businesses | over 90% | ~81% of employment |
| Regional champions (illustrative) | Safaricom, Equity, KCB, EABL, Bidco, Co-op | finance, telecoms, consumer goods |
Sources: KNBS (2016); Draft MSME Policy (2025); KAM (2025); company results (2024/25).
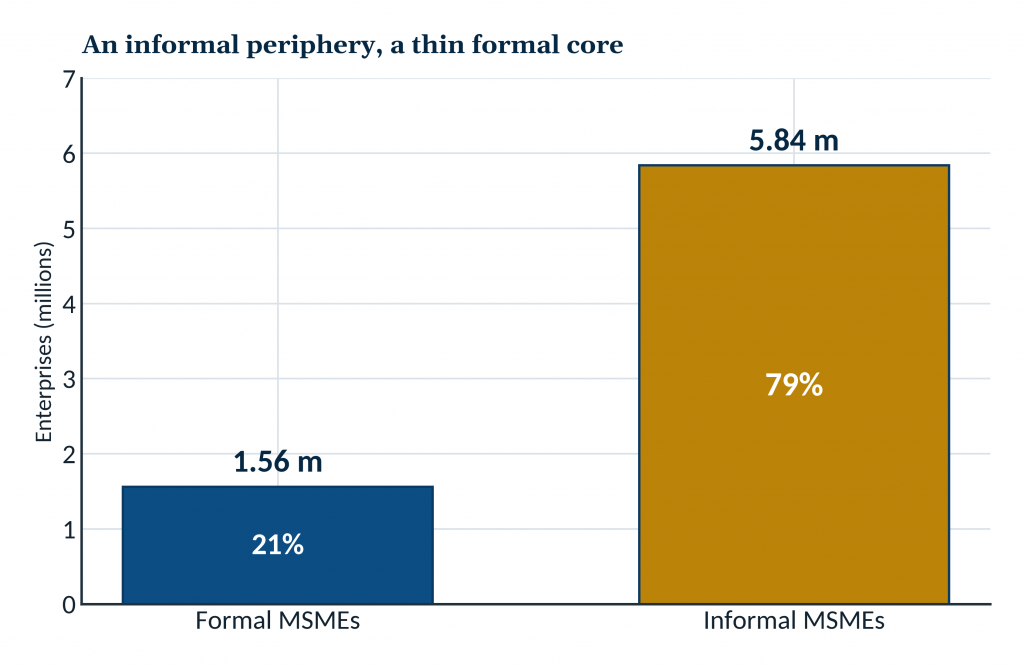 Chart 2. Formal and informal MSMEs. Source: KNBS (2016); Draft MSME Policy (2025).
At the other end sits a genuinely impressive set of champions. Safaricom is the most valuable listed company in East Africa, with a market capitalisation of around 8.4 billion dollars and group profit after tax of about 68.6 billion shillings in its 2024/25 year.7 Equity Group and KCB Group each hold assets above 2 trillion shillings and earn the bulk of their growth from subsidiaries across Uganda, Tanzania, Rwanda, South Sudan and the Democratic Republic of Congo.
East African Breweries, Bidco Africa and Cooperative Bank round out a roster that places 6 Kenyan firms among the 10 largest companies in the region and 11 Kenyan firms on the Financial Times list of Africa’s fastest growing businesses in 2025. These are not satellites of foreign multinationals. They are Kenyan-built firms that now invest across the continent.
Alongside these champions stands a second roster, younger and venture-backed, not yet at champion scale, that has made Nairobi the startup capital of the continent. M-Kopa has put solar kits, phones and credit into the hands of more than 5 million customers across the region; Sun King has taken pay-as-you-go solar to millions of off-grid homes; BasiGo is placing electric buses on Nairobi’s roads; Twiga, Wasoko and Kyosk have set out to rewire informal retail supply; Victory Farms has built East Africa’s largest aquaculture business; and Apollo Agriculture and Cellulant work the seams of farm credit and payments.
Kenyan startups raised about 1.04 billion dollars in 2025, more than any other country on the continent.8 It is a genuinely world-class generation of firms, and it carries the same signature as the giants above it. The two rosters cluster in the same narrow band, finance and telecoms for the corporates, fintech, energy access, mobility and agri-logistics for the startups, the digital services layered over the existing economy rather than the industry beneath it.
Both are asset-light, and neither, bar rare exceptions, makes things. The established champions went regional but stayed in services; the young ones draw global capital but stall between Series A and the scale that would turn them into large employers, with even a flagship like Twiga forced into deep layoffs after raising more than 160 million dollars.
Kenya has produced two celebrated private sectors, one mature and one emerging, and both bend away from the industrial middle the country most needs.
The trouble shows most clearly one layer down. Equity alone disbursed 45 percent of all MSME loans in Kenya in the first seven months of 2025, which shows both the reach of the champions and the narrowness of the field beneath them.7 Between the informal millions and the corporate handful, Kenya is missing the layer that carries industrial economies, the medium-sized productive firm that employs a few hundred people, supplies a larger one, exports to a neighbour and formalises a workforce. That missing middle is where inclusive growth is normally manufactured, and in Kenya it barely exists.
Where the money actually goes
If the constraint were simply a shortage of capital, the story would be easier. It is not. Credit to Kenya’s private sector reached a record 4.1 trillion shillings at the start of 2026, after climbing back from an outright contraction a year earlier.9 The capital is there. It goes to the wrong place.
The single most important fact about Kenyan finance is that the government is the borrower of first resort. Gross domestic public debt rose from 1.5 trillion shillings in 2015 to 5.9 trillion in 2024, a compound annual growth rate above 14 percent.9 Commercial banks held about 45 percent of that domestic debt in early 2025. For a Kenyan bank, lending to the state is close to riskless and pays well, so it does.
Lending to a manufacturer or a growing SME carries real risk and demands real work, so banks do less of it. This is crowding out at its most direct, and it shapes the whole economy. Manufacturing, the sector that turns raw output into formal jobs, receives only about 14 percent of bank credit, roughly the same share as private households.
It is worth being exact about the mechanism, because crowding out is easy to assert and harder to prove. The state’s borrowing raises the price and lowers the quantity of credit left for everyone else, but a second force runs alongside it: even at a given price, Kenyan banks prefer the collateralised, the large and the risk-free to the small and the unproven. The two compound. If the government borrowed less tomorrow, rates would ease, yet banks would not automatically march their money to the factory floor; the preference for safe, secured lending would remain. Freeing the productive firm therefore takes more than a smaller deficit.
Kenya has already run the experiment, and it is the most instructive episode in its recent financial history. In September 2016, to force down the cost of borrowing, Parliament capped lending rates at four percentage points above the policy rate. The intent was to widen access to credit; the effect was the reverse. Unable to price the risk of a small or unproven borrower at a capped rate, banks stopped lending to them and moved their funds into risk-free government paper.
Growth in the MSME loan book fell from about 15 percent a year to roughly 6, household credit slowed sharply, and lending contracted by more than a million accounts before the cap was ruled unconstitutional and repealed in 2019.9 The lesson is exact: when the intermediation channel is jammed, capital does not sit idle, it flows to the state, and the small productive firm is cut off first.
Kenya’s missing middle is not starved for want of money in the system; it is starved because the system is built to send that money somewhere safer.
It is worth being precise about the strength of this claim, because the link between public borrowing and private credit is easy to assert and harder to prove. Much of the evidence is a temporal correlation: domestic public debt rose, private credit slowed, and the two move together. But Kenya-specific work now goes further than co-movement.
A panel study of nine Tier 1 commercial banks from 2005 to 2023 finds that government securities held by banks have a statistically significant negative effect on private-sector credit, an effect that persists when the securities are lagged by a period, which is what one would expect if the borrowing drives the crowding-out rather than merely accompanying it.9 KIPPRA, analysing the composition of domestic debt, reaches the same conclusion from the other direction, identifying banks’ rising holdings of government paper as a direct source of susceptibility to crowding out.
The mechanism is not proven beyond all doubt, and no single country behaves like a textbook, but the Kenyan evidence is stronger than a coincidence of timing, and it points one way.
Look closely at what a Kenyan bank actually asks of a small firm and the phrase risk aversion becomes concrete. The lender expects to cover its exposure in full, so the security demanded matches or exceeds the loan; and although the Movable Property Security Rights Act has since 2017 allowed machinery, stock, receivables and even intellectual property to stand as collateral, and the registry is finally being used, most banks still reach for a title deed.10 The circularity is complete: if a firm already held cash or land equal to the sum it wishes to borrow, it would have little reason to visit the bank at all.
Lending to a small business requires a lender to spend time understanding it, which is precisely the effort that government paper does not demand. This is what an intermediation failure looks like at the counter, and no amount of liquidity in the system will fix it by itself.
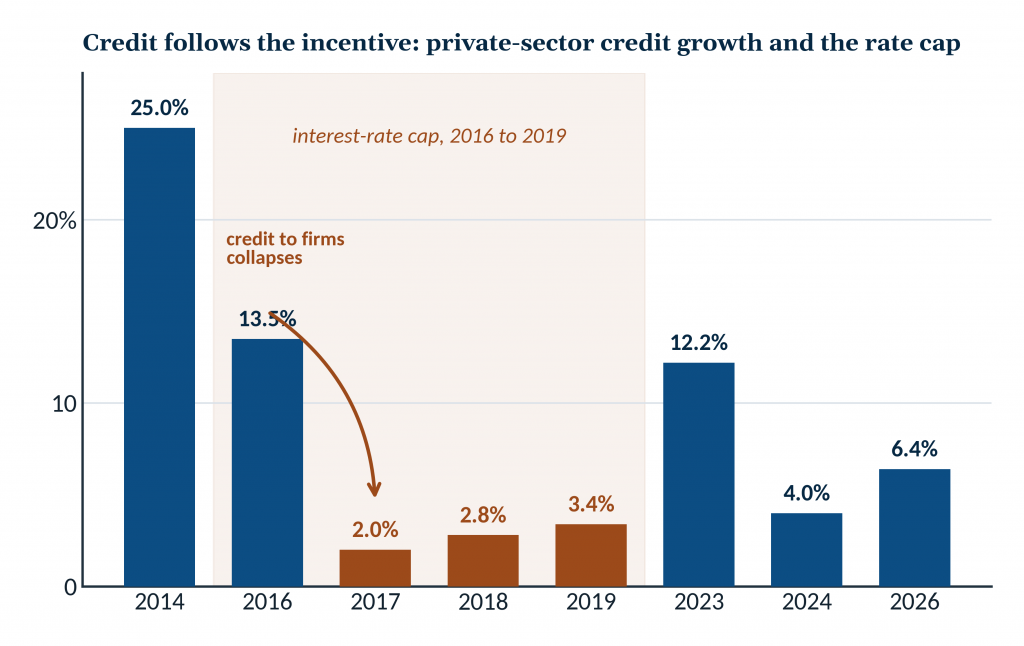 Chart 3. Private-sector credit growth collapsed under the interest-rate cap (2016 to 2019) and recovered after its repeal. Sources: CBK; World Bank; MicroSave; Cytonn. Year-on-year growth at selected dates.
Seen against the size of the economy, the shift is now macro-critical: public debt reached about 67 percent of GDP in 2025 and the fiscal deficit widened to 5.9 percent, so the state’s borrowing is large enough to set the price of money for everyone else.9
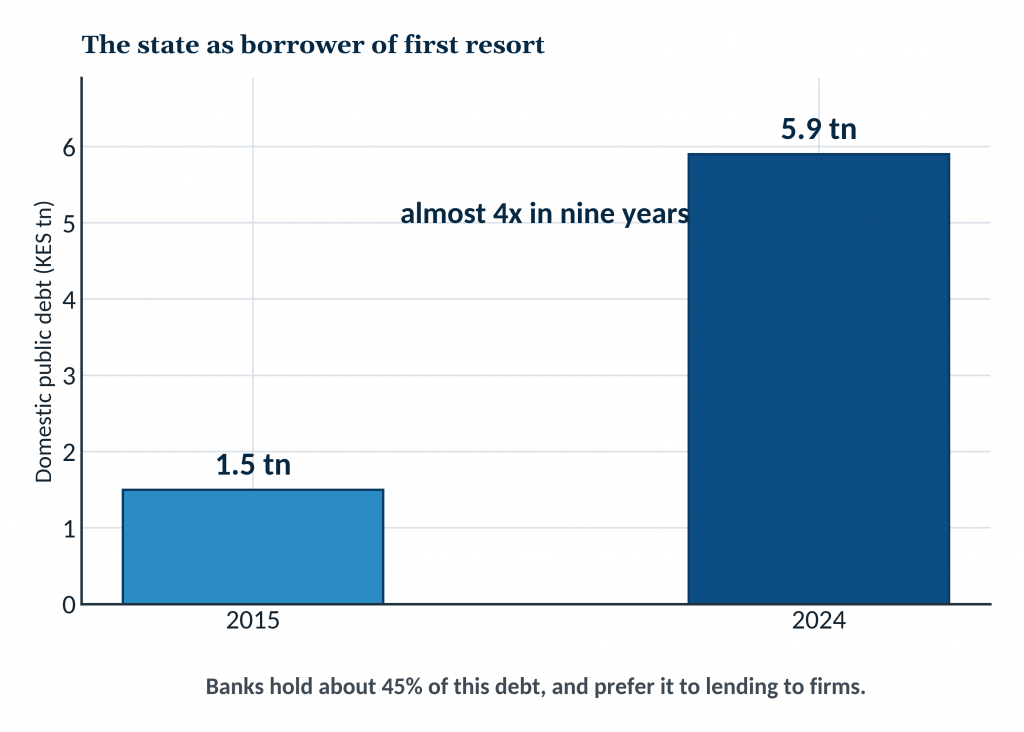 Chart 4. Gross domestic public debt, 2015 and 2024. Source: Central Bank of Kenya.
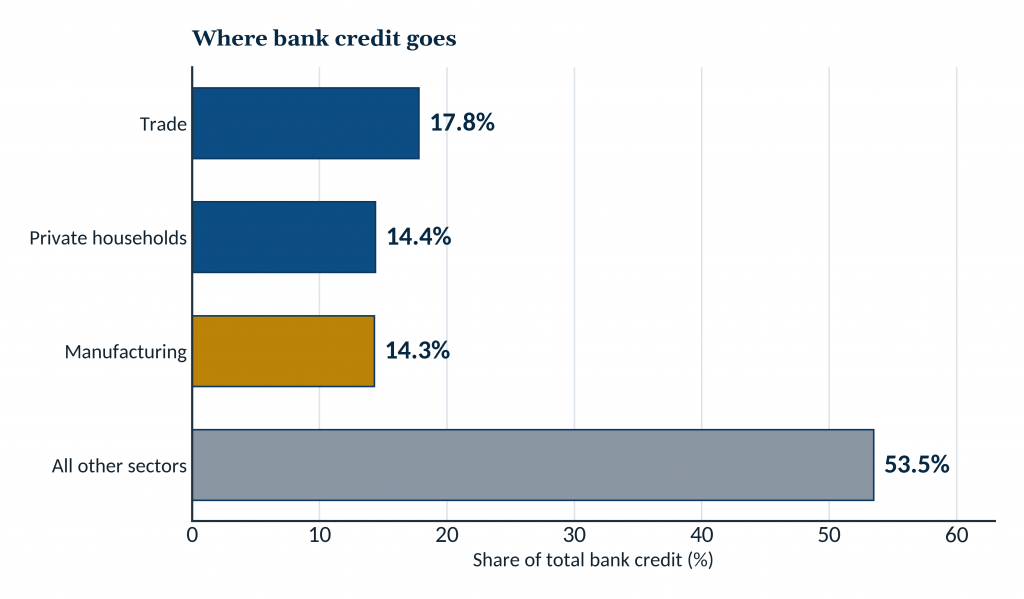 Chart 5. Bank credit by sector, January 2026. Source: Central Bank of Kenya.
Price compounds the problem of quantity. After ten consecutive cuts that brought its policy rate to 9.0 percent by December 2025, the Central Bank brought the average commercial lending rate down to about 14.8 percent by early 2026.9 But the average conceals a gulf. Rates ranged from around 10 percent at the international banks lending to blue chips to more than 19 percent at the lenders where a small business is more likely to knock.
A young firm with no collateral and no track record borrows, if it borrows at all, at the top of that range, and services the loan out of margins that a manufacturer competing against imports cannot easily protect. The financing gap for Kenyan MSMEs is estimated at around 4 trillion shillings, almost as large as the entire stock of credit the banking system extends to the private sector.
THE FINANCING GAP
gap ≈ KES 4.0 tn ≈ 0.98 × private-sector credit stock (KES 4.1 tn)
Not a shortage of loanable funds, which the banks hold in record quantity, but a failure to intermediate them: the credit small firms could bankably absorb is almost as large as every shilling the system now lends to the whole private sector.
There is an uncomfortable corollary. Kenya’s most celebrated private firms, its banks, earn some of their profit from the very arrangement that starves productive enterprise. A financial system that channels the nation’s savings into government paper and high-margin consumer lending is a profitable system. It is not a developmental one. The capital that could build factories and scale up suppliers is being lent, safely and lucratively, to the Treasury and to consumption.
Kenya has not been blind to this. Since December 2020 the state has run a Credit Guarantee Scheme designed to do exactly what the market will not, absorb part of the risk of lending to a small firm so that a bank will lend. It works in the narrow sense: every shilling the government has committed has unlocked about 2.32 shillings of private credit. But its scale is a rounding error against the need.
By late 2024 it had disbursed roughly 6.2 billion shillings to about 4,157 enterprises, against a financing gap measured in trillions, and the 2025 Budget Policy Statement now proposes to expand it toward 50 billion shillings of lending and to license private guarantee companies.9 The instrument is right. It has simply never been built to the size of the problem.
Mapping the Silicon Savannah
Against this backdrop, one part of the private sector shines, and it earns its reputation. Nairobi is the most developed startup ecosystem on the continent, and it rewards a close look, because the ecosystem’s promise and its limits sit in the same details.
Kenya has about 419 formally tracked startups, more than half of all those in East Africa, and its ecosystem ranks 58th in the world and first in the region after growing by a third in a single year.11 Close to six in ten of them are based in Nairobi. The city carries the scaffolding of a real ecosystem.
The ecosystem’s institutions are dense and real. iHub, the anchor since 2010, has worked with more than 450 startups and 10,000 entrepreneurs and now houses venture funds such as TLcom under its own roof; incubators and accelerators run from Nailab and GrowthAfrica to Antler and the Baobab Network; Google, Microsoft, Visa and Intel keep regional offices in the city; and Konza Technopolis, a purpose-built innovation city, is meant to anchor the next stage.
What Nairobi builds sets it apart. Where Lagos and Cairo run on fintech, Kenya’s founders concentrate in the sectors closest to the physical economy: mobility, logistics, clean energy, agriculture and health. M-Kopa finances solar systems and phones for low-income households, BasiGo puts electric buses on the road, Twiga links farmers to vendors, Victory Farms runs the region’s largest aquaculture business, and Sun King opened a solar-assembly plant in Nairobi in 2025.11 This is a tech scene wired into the real economy rather than floating above it, and that connection is its genuine strength.
The Nairobi ecosystem in numbers
| Indicator | Value |
|---|---|
| Tracked startups (Kenya) | about 419, over half of East Africa’s |
| Global ecosystem rank | 58th, and 1st in East Africa |
| One-year ecosystem growth | +33.5% |
| Share of startups based in Nairobi | about 58% |
| iHub alumni | 450+ startups, 10,000+ entrepreneurs |
| Funding raised, 2025 | US$1.04bn, about a third of Africa’s total |
| Debt share of that funding | 48% |
| Leading sectors | mobility, energy, agritech, health, logistics |
Sources: StartupBlink (2025); Startup Genome; Partech (2025); iHub.
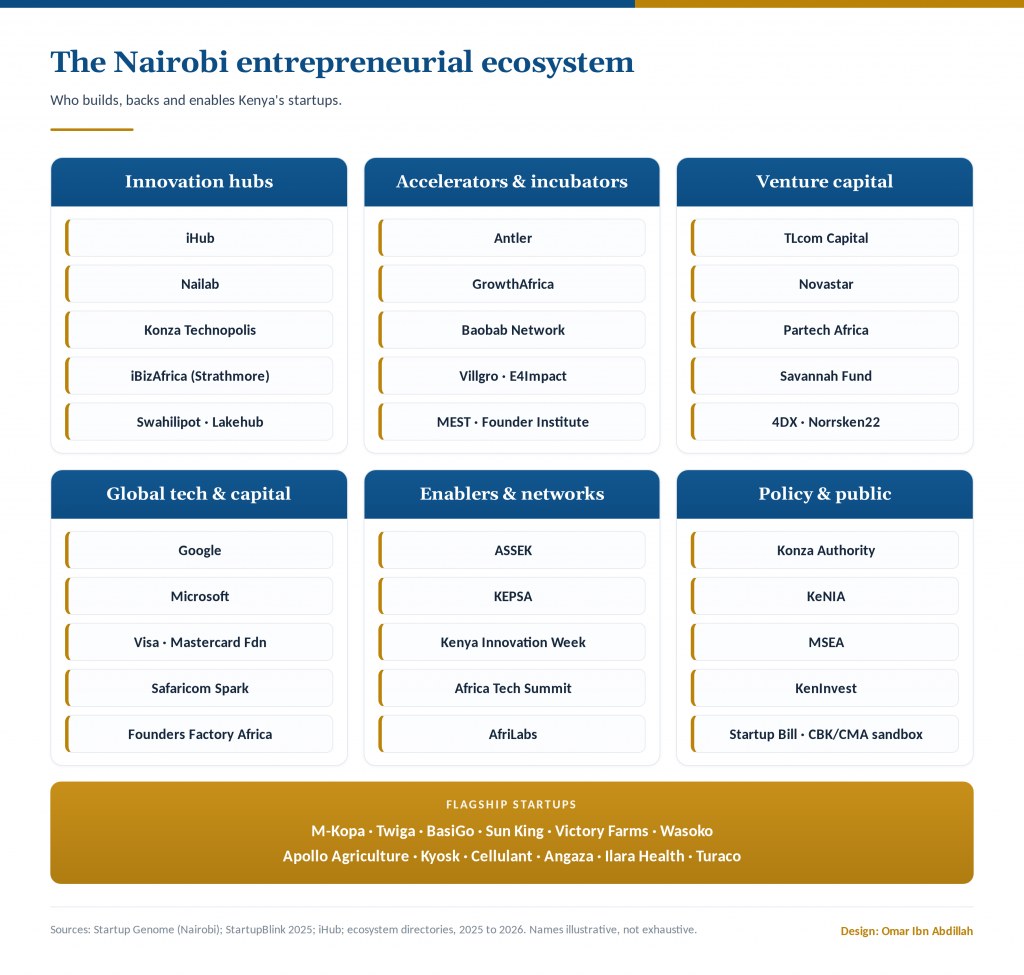 Figure 2. The actors of the Nairobi entrepreneurial ecosystem. Sources: Startup Genome; StartupBlink (2025); iHub; ecosystem directories.
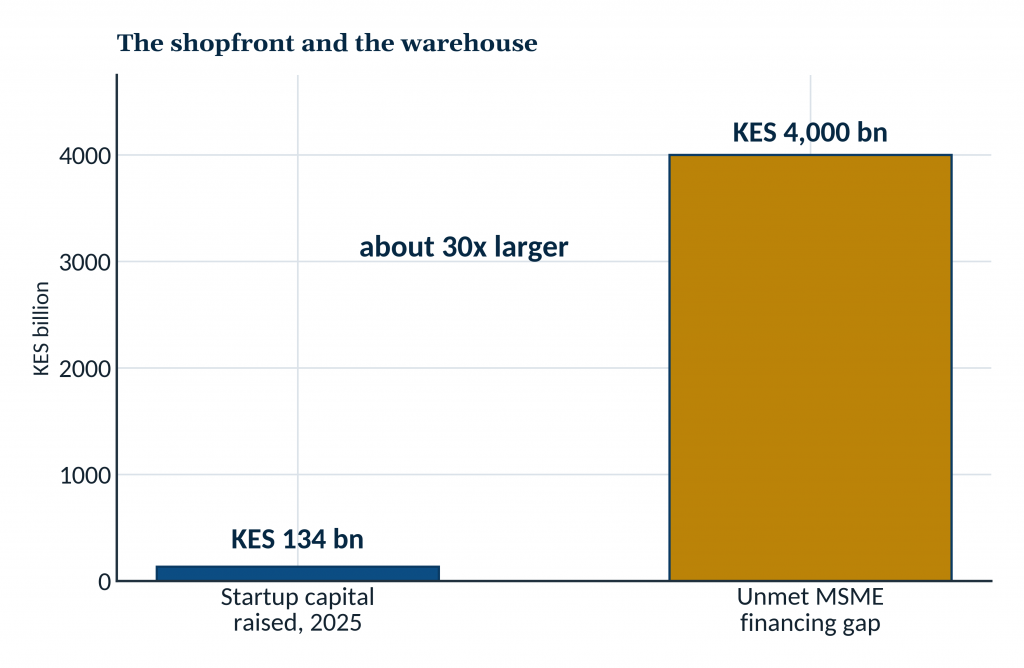 Chart 6. Startup capital raised in 2025 against the MSME financing gap. Sources: Partech (2025); Draft MSME Policy (2025). Dollar figure converted at about KES 129.
Two weaknesses run through it. The first is the scale-up gap. Kenyan founders raise seed and early money with relative ease, but the capital thins sharply between Series A and the later rounds that build large firms, and even well-funded companies stumble, as Twiga Foods’ layoffs after raising more than 160 million dollars showed.11 The second is talent, with the data science and machine-learning skills the ecosystem needs in short supply. A third weakness is structural and rarely stated: venture capital is not built for the ordinary Kenyan enterprise.
A fund underwriting exit multiples of eight to twelve times earnings needs companies that can compound at a speed the Kenyan operating environment, with its power tariffs, tax volatility and thin margins, rarely permits, so the great majority of viable small firms are simply outside its mandate. Nor is there much domestic risk capital to fill the space beneath it: Kenya has no real angel-investor class of the kind that seeds early companies in other markets, and most of the money behind its startups is foreign.
The missing middle, in other words, is missed twice, by banks that want collateral and by funds that want multiples. The result starts many companies and scales few, the missing-middle problem of the wider private sector in a more glamorous setting. 1 billion dollars, impressive as it is, has to be kept in proportion: set beside the 4 trillion shilling financing gap facing the country’s small firms, the entire 2025 startup haul is roughly 30 times smaller.
Kenya among Africa’s hubs
Step back to the continent and Kenya’s position becomes clearer, and more precarious. In 2025 Kenya raised more startup capital than any other African country, about 1.04 billion dollars, ahead of South Africa’s 715 million, Egypt’s 604 million and Nigeria’s 572 million.8 These four hubs took 72 percent of all the capital raised on the continent, a concentration that has barely moved in three years. For a single quarter of 2025, Nairobi alone drew 54 percent of every startup dollar invested in Africa, the most concentrated quarter in the continent’s venture history.11
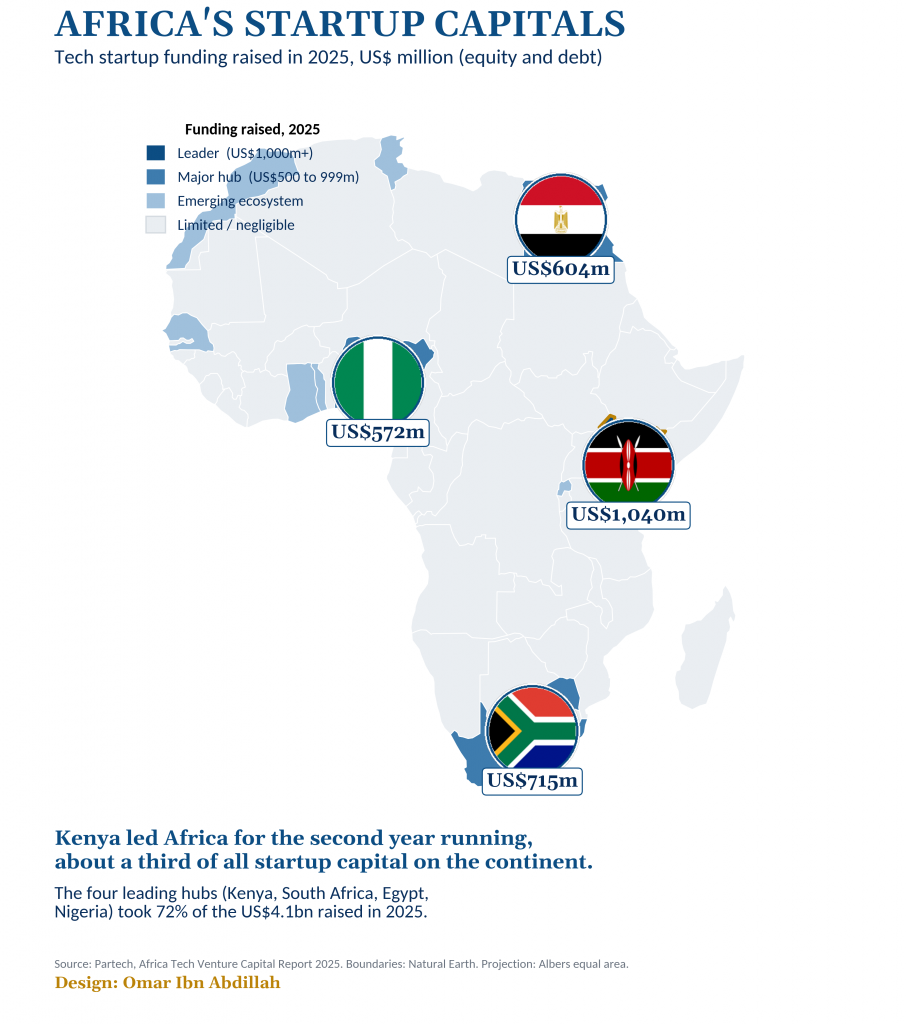 Figure 3. Tech startup funding by country, 2025. Source: Partech, Africa Tech Venture Capital Report 2025.
The shape of Kenya’s lead matters as much as its size. South Africa leads on equity, the patient capital that buys ownership and shares risk, raised for 90 percent of its total. Kenya leads on debt, which made up 48 percent of its funding, and on megadeals: four transactions above 100 million dollars accounted for 60 percent of everything the country raised.8 A lead built on a handful of large debt rounds is narrower and more fragile than one built on a broad base of equity, and when those deals slowed later in the year, Kenya’s monthly ranking slipped.
Each hub has found its lane. Nigeria runs on payments, Egypt on fintech and e-commerce reaching into the Gulf, South Africa on enterprise software and energy, Kenya on the physical-economy sectors. Kenya’s lane is the most useful for inclusive growth, because mobility, energy, agriculture and logistics touch the many rather than the few. The task is to turn that lead into firms that employ at scale, which returns the argument from the shopfront to the warehouse.
The factories that keep shrinking
Nowhere is the misallocation clearer than in manufacturing. Kenya’s industrial base is the largest and most diversified in East Africa, and it is shrinking as a share of the economy. Manufacturing contributed about 11 percent of GDP in the early 2000s and around 10 percent between 2011 and 2016. By 2025 it had fallen to 7.1 percent, against a Vision 2030 target of 15 percent that now reads as fantasy.12 Economists have a name for an economy whose factories retreat before its workers have left the farm, premature deindustrialisation, and both the World Bank and Kenya’s own manufacturers now use it openly.
The African diagnosis is sharper than the borrowed word. The African Center for Economic Transformation measures development not by growth but by DEPTH, diversification, export competitiveness, productivity, technology and human wellbeing, and its 2025 Kenya outlook singles out the two sectors this note has followed, small-scale manufacturing and the digital economy, as the ones that will decide whether the country transforms or merely grows.13 By that African measure Kenya is growing without transforming: output rises, the structure beneath it does not, and labour moves sideways into low-productivity informality rather than up into industry.
Growth without transformation is the continent’s oldest trap, and Kenya is walking into it with better scaffolding than most.
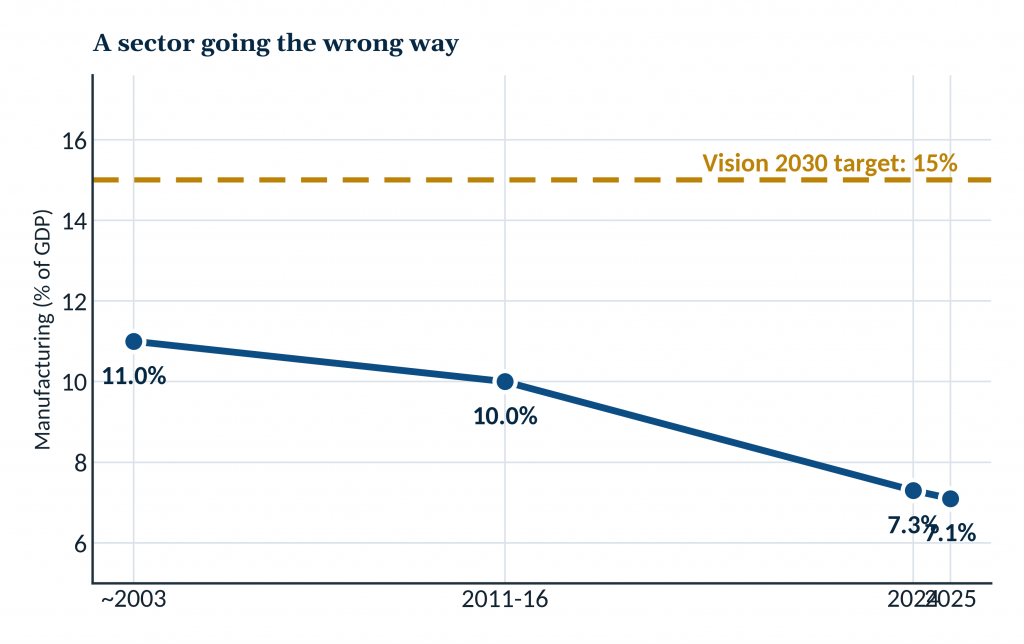 Chart 7. Manufacturing as a share of GDP. Source: KNBS; KAM (2025). Points are approximate period readings.
The retreat is not for want of importance. Manufacturing still employs about 389,000 people in formal wage jobs, nearly 12 percent of the formal total, and contributes close to 18 percent of Kenya’s tax revenue.12 It is exactly the kind of activity Kenya needs more of, formal, taxed, linked to farms and services.
And it is going backwards. Agro-processing, the natural bridge between a farming country and an industrial one, contracted in 2025, dragged down by a 25 percent collapse in sugar output and falling fruit and vegetable processing. On the United Nations Industrial Development Organisation’s competitiveness index, Kenya ranks 112th in the world, far behind South Africa at 53rd and Egypt at 68th.
The deepest irony sits in agriculture. Farming still accounts for roughly a fifth of GDP, yet Kenyan manufacturers import maize, wheat, soybeans, sugar and fruit concentrate because the links between what the country grows and what its factories process are weak or broken.6 A nation that exports raw tea and cut flowers and imports processed food is leaving the most obvious value on the table. The factories that were promised have not so much failed as never been built, and the ones that exist are being squeezed out by costs the next section describes.
The cost of making things in Kenya
Ask a Kenyan manufacturer why the sector shrinks and the first answer is power. Industrial electricity in Kenya costs around 0.185 dollars per kilowatt hour, the highest among the region’s economies and close to one and a half times the African average.6 Across the region the gap is not marginal but categorical: Ethiopia, Egypt, Tanzania and Uganda all price industrial power well below Kenya, in several cases at a fraction of it.
Two qualifications keep the comparison honest. A headline tariff is not the whole cost, since the average Kenyan factory also loses an estimated 10 to 15 percent of its output to outages and voltage swings, so the effective burden runs higher than the sticker rate; and the cheapest regional tariffs come with their own reliability problems, so the right reading is an order of magnitude, not a precise multiple.
Even read cautiously, the direction is unambiguous, and manufacturing consumes about 65 percent of the power Kenya generates, so the penalty falls hardest on exactly the sector the country says it wants to grow. Ethiopia sharpens the point: in the year to June 2025 it sold Kenya a record 1,274 gigawatt hours of hydropower, cheaper than Kenya’s own thermal plants, and has used the same cheap power at home to attract light-manufacturing investors Kenya has lost.14
The point here is narrow and worth isolating from the argument that follows: what Kenya can usefully borrow from Ethiopia is the price of energy, not the industrial-park model, whose disappointing results this note examines below.
Cheap power is an input any factory wants; a state-built park full of footloose foreign firms is a strategy that, on Ethiopia’s own record, did not deliver.
THE POWER HANDICAP
Kenya US$0.185 / kWh vs regional peers, a fraction of it
Kenyan industry pays the highest power tariff in the region, and loses a further tenth to a seventh of its output to unreliable supply, before a single worker is hired. The exact multiple depends on which peer and which year; the direction does not.
Industrial electricity tariffs, selected African economies (US$ per kWh, around 2025)
| Country | Industrial tariff |
|---|---|
| Ethiopia | 0.01 to 0.05 |
| Egypt | 0.03 to 0.06 |
| South Africa | 0.03 to 0.09 |
| Tanzania | 0.09 |
| Uganda | 0.10 to 0.125 |
| Kenya | 0.185 |
Sources: KAM, Manufacturing Priority Agenda 2025 (regional audit with TradeMark Africa); EPRA / GlobalPetrolPrices, 2025.
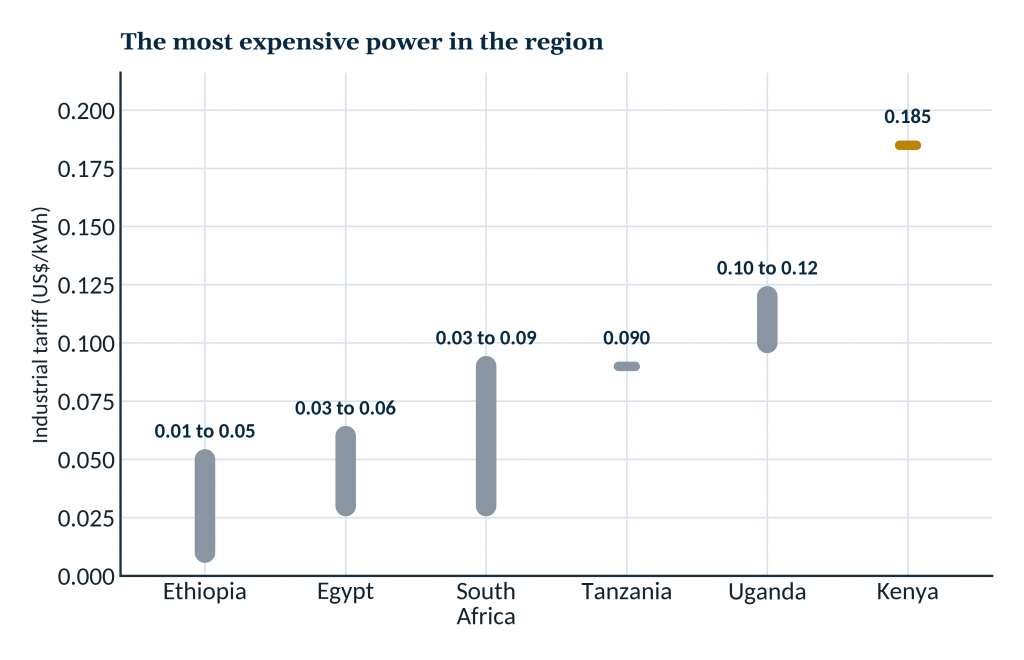 Chart 8. Industrial electricity tariffs compared. Sources: KAM (2025); EPRA / GlobalPetrolPrices (2025).
Power is the sharpest cost, not the only one. Credit is dear and crowded out. The tax regime is heavy and unstable, layering national and county levies on raw materials and machinery, and a new standards levy of 0.2 percent of monthly turnover on top.15 The government owed manufacturers about 35 billion shillings in unpaid value added tax refunds in early 2026, draining the working capital of the very firms it wants to grow.6 Cheap imports and counterfeits crowd the shelves, and the skills the sector needs, in engineering, mechatronics and industrial maintenance, are in short supply because the education system trains for other things.
Each of these is a tax on making things in Kenya, and together they explain why capital that could go into a factory goes into government paper or a shopping mall instead.
Taxed narrow, and taxed often
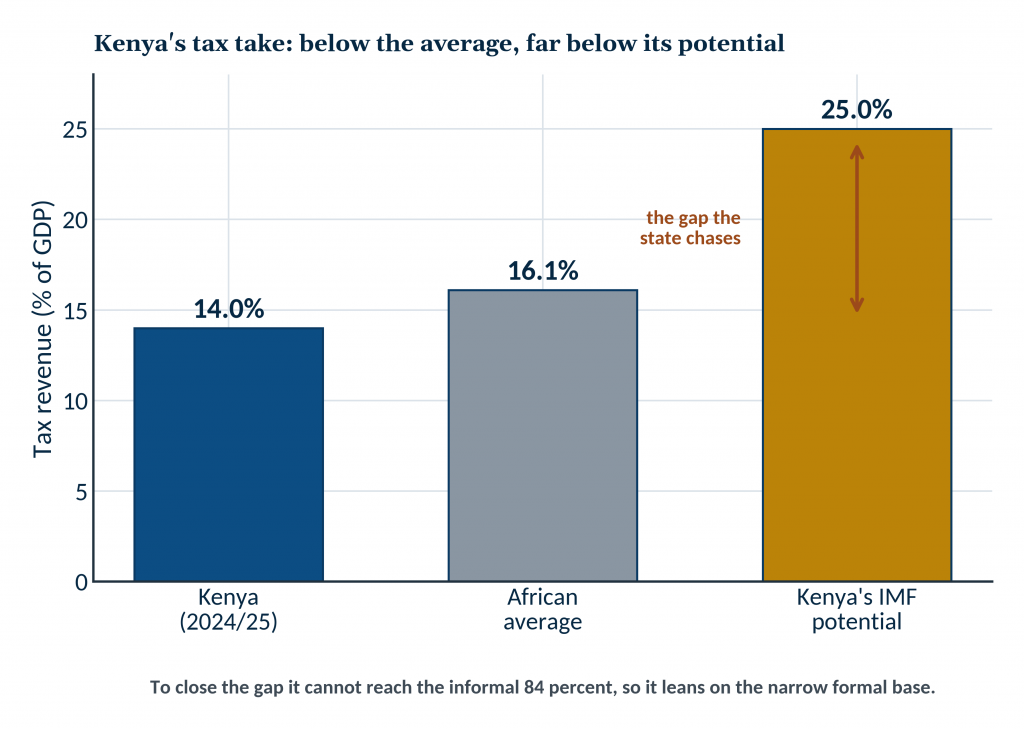
Power is a cost the state could lower. Tax is a cost the state imposes, and in Kenya it falls on the few. The country raised about 2.92 trillion shillings in the 2024/25 fiscal year, missing its own target by some 62 billion, and its ordinary revenue sits near 14 percent of GDP: a little below the African average and far short of the 25 percent the East African Community and the IMF judge it could reach.16 That gap is the heart of the matter.
A state that cannot reach the informal 84 percent of its workforce closes the shortfall by leaning ever harder on the narrow formal base it can reach.
On that base the rates are heavy and they multiply. A company pays 30 percent on its profit and adds 16 percent value added tax; its employees lose up to 35 percent to income tax, and on the payroll sit a 1.5 percent housing levy and a 2.75 percent health contribution, each carried in part by the employer, alongside rising pension deductions.16 For the formal firm this is the full weight of the state. For the informal enterprise beside it, most of it simply does not apply.
THE FORMALISATION PENALTY
Formal: 30% company tax, 16% VAT, +1.5% housing, +2.75% health, +pension. Informal: almost none.
The tax structure loads the narrow formal base and lets the informal majority escape, penalising the very step into formality that would widen the base. Sources: KRA; PwC Tax Summaries 2025.
This is the fiscal face of the formalisation trap. The surest way to widen a tax base is to formalise the enterprises outside it, yet Kenya’s structure does the opposite: it makes formality expensive and informality cheap, so in effect it taxes the act of formalising. The firm that registers, hires on contract and files returns takes on a burden its informal rival never carries, which is a standing reason to stay small and unregistered. A tax system built to raise revenue in the short run entrenches the narrow base that starves it in the long run.
Weight is compounded by unpredictability. Kenya has rewritten its tax code almost every year: the Finance Act 2023, whose housing levy the courts struck down for want of an enabling framework; the Finance Bill 2024, which sought about 346 billion shillings and was withdrawn in June 2024 after nationwide protests, forcing budget cuts of close to a trillion shillings; the Tax Laws Amendment Act at the end of 2024; and the Finance Act 2025.15 A manufacturer weighing a five-year investment cannot know what the rates, levies or refund rules will be in its second year. Predictability is itself a form of investment promotion, and Kenya has spent it.
Even the money the state owes comes back slowly. It held about 35 billion shillings in unpaid value added tax refunds owed to manufacturers in early 2026, working capital frozen in the accounts of the firms it most wants to grow, and the Finance Act 2025 shortened the window in which such claims can be made.15 The deeper lesson of June 2024 is not only political.
It is that the formal base and the urban young have reached the ceiling of what they will bear, so the answer cannot be a higher rate on the same few. It has to be a wider base, which means formalisation, which returns the argument to the private sector.
There is a question the tax debate in Kenya almost never asks, and it matters more than the rate. Not how much is collected, but where it goes once it is. A tax that funds the roads, the power and the institutions a firm needs is an investment the private sector recovers; a tax that funds a wage bill and a debt service is a transfer it does not.
Kenya’s budget answers plainly. Of the 4.3 trillion shillings the state planned to spend in 2025/26, development expenditure came to about 693 billion, roughly a sixth of the total, while recurrent spending took close to three quarters, and the Treasury itself concedes that debt costs now absorb nearly half of ordinary revenue.17 The state borrows from the banks, crowding out the firm, and then spends the proceeds largely on servicing what it already owes and paying those it already employs.
Both ends of the transaction drain the productive economy.
The contrast with the recent past is instructive rather than nostalgic. Mwai Kibaki inherited a public debt of about 633 billion shillings in 2003 and left one near 1.79 trillion, but he spent it opening the economy, and growth followed. Public debt has since multiplied many times over, and the share of it that reaches productive capacity has shrunk. That is the fiscal fact that gives the June 2024 protests their economic meaning: the objection was never only to the size of the burden, it was to the sense that the burden buys nothing the taxpayer can see.
There is a further trap in the composition of the debt, and it bears directly on the crowding-out argument. About 46 percent of Kenya’s public debt is external, and roughly two thirds of that external stock is denominated in US dollars, so a weaker shilling raises the local-currency cost of servicing it without a single new loan being signed.25 This is why the state’s recent tilt toward domestic borrowing is not simply fiscal preference: borrowing at home in shillings removes the currency risk that dollar debt carries. But the two risks trade against each other rather than cancel.
Every shilling the Treasury raises at home to escape exchange-rate exposure is a shilling it takes from the same domestic pool the private firm draws on, deepening the crowding-out this note has traced. Kenya is thus caught between a currency risk it carries abroad and an intermediation cost it imposes at home, and it cannot retire one without enlarging the other. Only a credible path to spending less, and taxing a wider base, loosens both at once.
What suffocates the private firm
It helps, at this point, to gather the constraints into a single picture, because a firm does not meet them one at a time. It meets them together, and they compound.
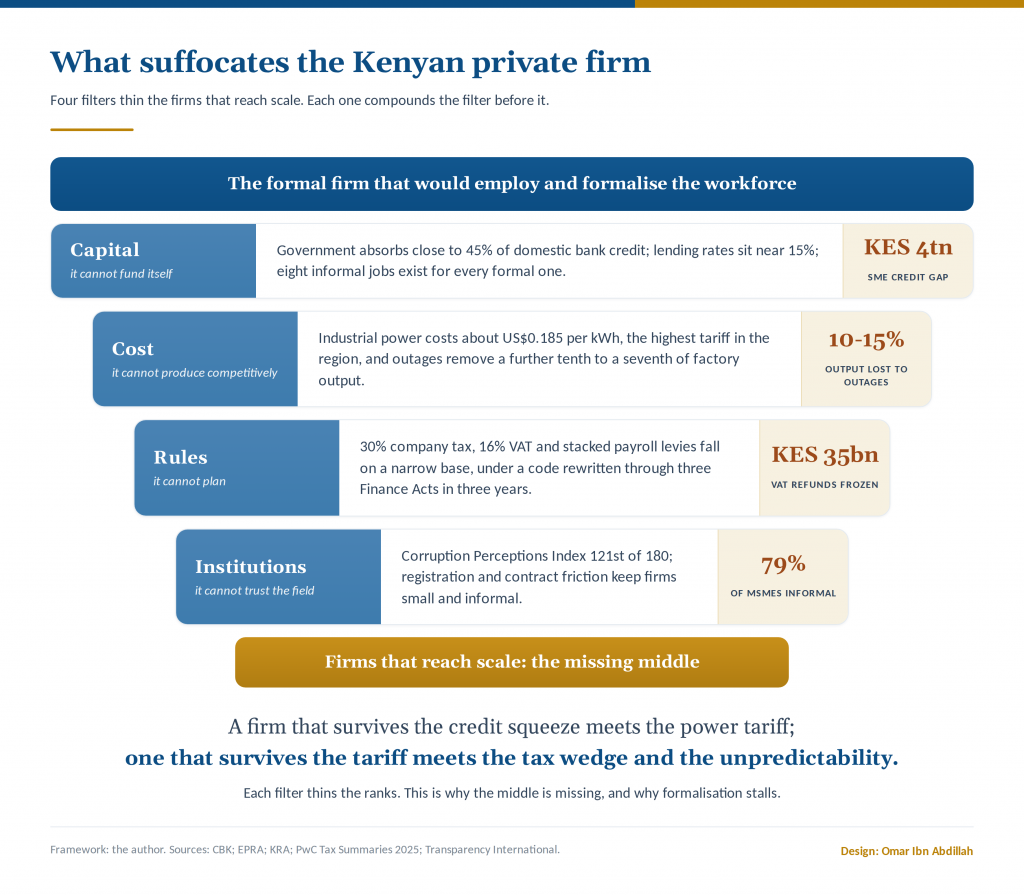 Figure 4. What suffocates the Kenyan private firm: four filters that thin the firms reaching scale. Author’s framework. Sources: CBK; EPRA; KRA; Transparency International.
Set the firm Kenya most needs, the medium producer that would employ a few hundred people and formalise a supply chain, at the mouth of a funnel. The first filter is capital: it competes for credit with a government that absorbs close to half of what the banks lend, at rates near 15 percent. The second is cost: clear the credit filter and it meets a power tariff several times its regional rivals’.
The third is rules: produce anyway and it carries a tax and levy burden the informal firm beside it escapes, under a code rewritten almost every year. The fourth is institutions: registration, contract enforcement and the friction of an economy in which staying informal is often the rational choice.
Each filter alone is survivable. Together they are not, and that is the point. The firm that clears the credit squeeze meets the tariff; the one that clears the tariff meets the tax wedge; the one that clears the wedge meets the unpredictability. At each stage the number of firms that reach scale is thinned, which is precisely why the middle is missing. The missing middle is not a riddle of Kenyan enterprise. It is the arithmetic of four filters applied in sequence, and it is why formalisation stalls and growth reaches too few.
The capital that comes, and the capital that leaves
If domestic capital shuns production, foreign capital has never arrived at the scale the rhetoric implies. Kenya drew about 1.5 billion dollars of foreign direct investment in 2024, flat on the year, and holds an FDI stock worth around 11 billion dollars, barely a tenth of GDP.18 The government’s own plan sets a target of 10 billion dollars a year by 2027, up from 500 million in 2022, a goal so far from the trend that it functions more as aspiration than forecast.
Recurring political shocks, an unpredictable tax regime and a corruption ranking of 121st out of 180 keep the serious money cautious.19 Some of the foreign capital that does come now buys existing Kenyan champions rather than building new capacity, with South African groups committing more than 400 billion shillings to stakes in Safaricom, NCBA and others.
The more interesting number is the one Kenyans send themselves. The diaspora remitted about 5.08 billion dollars in the year to mid 2025, more than three times the country’s annual FDI and its single largest source of foreign exchange.18 That is patient capital with a stake in the country’s success, and Kenya has barely begun to channel it toward productive investment rather than household consumption. The instruments that would turn remittances into factories, diaspora bonds, co-investment vehicles, credible savings products, remain thin.
Behind both the shortfall in investment and the shape of public spending lies a question of allocation rather than volume. Kenya has borrowed heavily over the past decade, and too little of what it borrowed went into the roads, power and skills that would have raised the return on private investment. An earlier period of tighter external borrowing paired with clearer sectoral priorities, including the expansion of free primary education, produced dividends the country is still drawing on.
The lesson is not that Kenya borrowed, but what the borrowing bought. Debt raised to fund productive capacity widens the base from which the private sector grows. Debt that leaks away narrows it, and leaves the bill without the asset.
What the region teaches, and what it does not
The instinctive fix, when a country’s factories stall, is to copy the neighbour whose factories did not. For a decade that neighbour has been Ethiopia, and its model deserves a closer look than it usually gets, because the lesson is not the one the headlines suggest.
Ethiopia bet on state-built industrial parks to attract foreign light manufacturing. Manufacturing FDI rose from about 1 billion dollars to 3.5 billion between 2012 and 2016, and employment in the parks grew from roughly 14,000 to 68,000 by 2019.20 Impressive on its face. Set against the plan, it disappoints. The strategy aimed to create two million jobs by 2025 and to lift manufacturing from 4 to 20 percent of GDP.
By mid 2018 the parks employed around 50,000 people, and manufacturing still sits below 5 percent of Ethiopian GDP. One study found that 77 percent of industrial park workers left within a year, on wages and conditions that made the jobs a source of resentment rather than advancement. The model attracts capital, but foreign capital, footloose and low wage, with thin links to local firms.
The deeper pattern is continental. When economists compared manufacturing in Ethiopia and Tanzania with the Asian success stories, they found that African industrial growth has been driven by domestic demand and has expanded mainly the small and informal firms, while in Taiwan and Vietnam it was driven by exports and expanded formal employment.20 African economies have been thickening their informal periphery, the same periphery Kenya knows so well, rather than building the formal industrial core. Copying the industrial park, in other words, does not by itself buy the thing Kenya needs.
Rwanda’s recent turn is more instructive. After years of chasing a services-led leap, Kigali now pushes labour-intensive, export-oriented manufacturing, and the advice its own analysts give is telling: specialise, cluster, and above all bring in the Rwandan private sector to invest, rather than relying on foreign capital alone.20 That is the endogenous logic Kenya should recognise, because Kenya is further along it than any of its neighbours. On the measures that matter for building things, quality of infrastructure and the complexity of what the country already produces, Kenya scores well; on electricity, skills and recent momentum, it scores poorly. The gap between those two is the whole agenda.
Three routes to industry, and what each one teaches
| Model | Approach and result | Where it falls short |
|---|---|---|
| Kenya | Diversified private base but weak coordination; largest, most diversified base in East Africa, with regional champions in finance, telecoms and consumer goods | Manufacturing down to 7.1% of GDP; crowding-out, high power costs, a missing middle |
| Ethiopia | State-built industrial parks for FDI; manufacturing FDI from about 1 to 3.5 billion dollars, and park jobs from 14,000 to 68,000 | About 77% of park workers leave within a year; job and GDP targets badly missed; low-wage, FDI-dependent, thin local linkages |
| Rwanda | Services-led, now pivoting to labour-intensive, export-oriented manufacturing, with emphasis on the domestic private sector | Early stage; small industrial base |
| Vietnam and Taiwan (benchmark) | Export-led, supply-driven growth; formal manufacturing employment took off | Scale and policy consistency hard to replicate |
Sources: Diao and others (2021); ODI (2018); benchmark data from KNBS, KAM and Partech.
Kenya’s own record with state-led industrial projects carries the same warning, and it is worth naming honestly. Konza Technopolis was conceived as the physical anchor of the digital economy, a 14.5 billion dollar city that was to hold 20,000 residents by 2020; it has not come close, and much of the tech industry it was built for has moved on.21 The reasons are instructive. A serviced plot in the savannah is not an ecosystem.
The firms Konza was meant to attract need the schools, hospitals and neighbourhoods their staff want to live in, and the lawyers, bankers, accountants and clients they deal with daily, all of which sit in Nairobi. Worse, a large public construction programme in Kenya attracts, almost by reflex, the connected contractor, so the cost of building rises and the commercial terms eventually offered to the tenant firms become prohibitive rather than supportive.
The lesson is not that the state should do nothing. It is that build it and they will come is not an industrial policy, and that a stimulus captured on the way out reaches no one. The most useful thing the state can do for the productive firm is to unblock the channels this note has traced, not to build the firm a city.
The private sector is the inclusive-growth engine
Everything above becomes concrete in a single number. In 2025 Kenya’s economy created 822,100 jobs, and 87 percent of them were informal.22 The formal private sector, the part that pays a regular wage, withholds a tax and offers a contract, added roughly 54,000 jobs in the whole year, against a labour market that takes in some 800,000 new entrants annually. That ratio, not the headline growth rate, is the truest measure of whether the economy works for Kenyans, and it is the mechanism through which the private sector decides how inclusive growth will be.
The link between private-sector structure and inclusive growth is usually left implicit. It is worth making explicit, because it runs through four channels, and in Kenya each of the four is throttled.
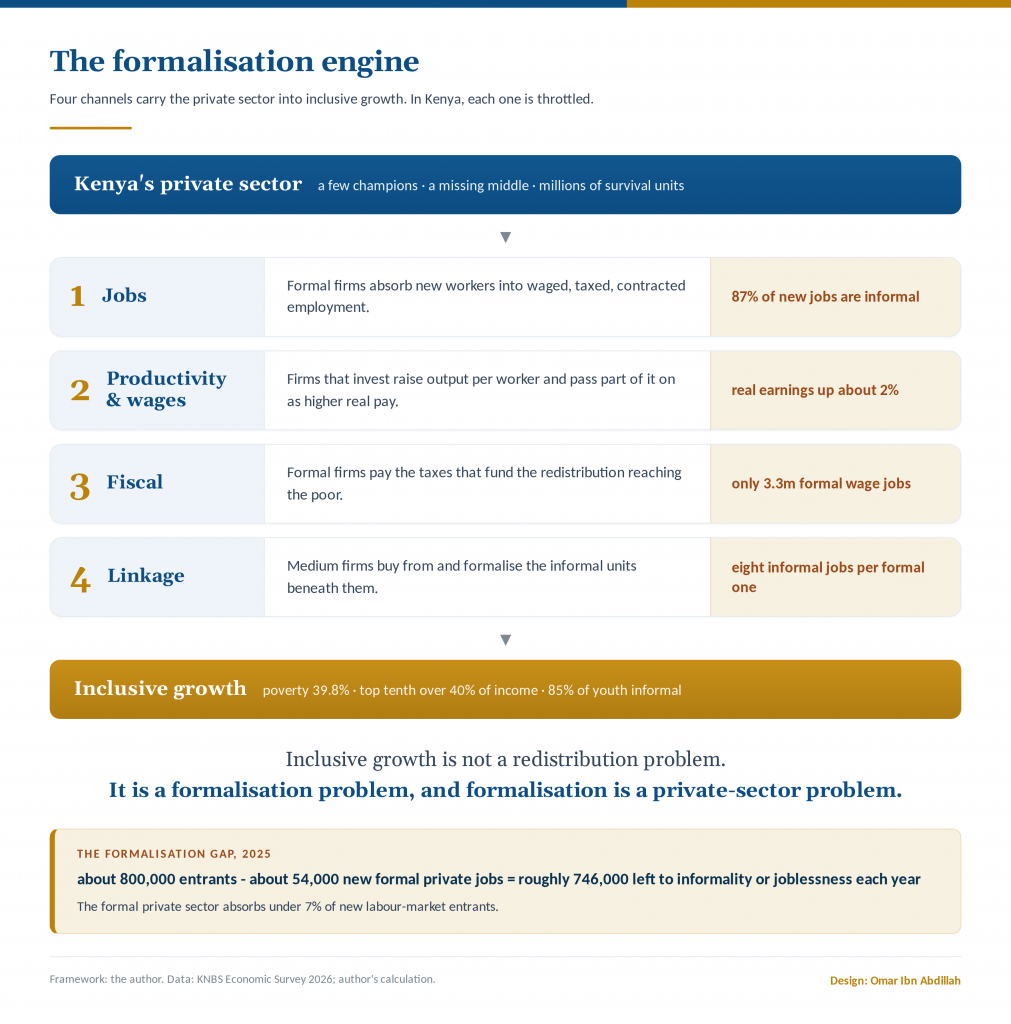
Figure 5. The formalisation engine: four channels from the private sector to inclusive growth. Author’s framework. Data: KNBS Economic Survey 2026.
The first is the jobs channel. A productive private sector absorbs the young into formal, waged work faster than they arrive. Kenya’s does the reverse: nine in ten new jobs are informal, and formal wage employment, at 3.3 million, has barely moved as a share of a workforce of 21.6 million.22 The formal firm that would turn a school-leaver into a taxpayer is not being created at anything close to the rate required.
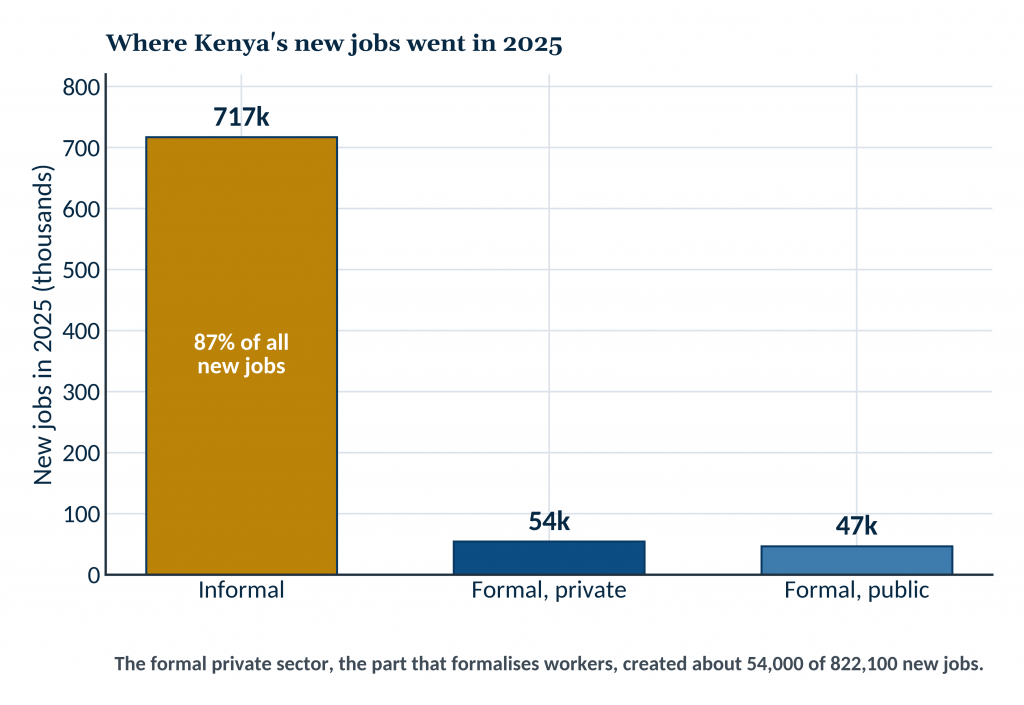 Chart 10. New jobs created in Kenya in 2025, by type. Source: KNBS, Economic Survey 2026.
The second is the productivity and wage channel. Firms that invest in equipment and skill raise output per worker and pass part of it on as higher real pay. In Kenya real average earnings rose about 2 percent in 2025, and the modern-sector wage of roughly 988,000 shillings a year sits far above informal earnings that carry no floor.22 The escalator exists; too few Kenyans can step onto it, because the productive firms that run it are too few.
The third is the fiscal channel. Formal firms pay the taxes that fund the services and transfers reaching the poor. Manufacturing alone contributes about 18 percent of Kenya’s tax take from 7 percent of GDP.12 But a formal base of 3.3 million wage jobs is a thin foundation for a country of some 55 million, so the state borrows to fill the gap, and that borrowing crowds out the very credit the private sector needs, closing the loop this note has traced.
The fourth is the linkage channel, and for distribution it is the decisive one. Medium-sized firms pull informal units upward: they buy from small suppliers, subcontract to workshops, and formalise a workforce as they grow. Kenya’s missing middle severs that channel. With 18.1 million in informal work against 2.2 million in formal private jobs, the ratio is roughly eight to one, and the survival units at the base have almost nothing above them to attach to.22
THE FORMALISATION GAP
800,000 entrants – 54,000 new formal private jobs = about 746,000 a year
The formal private sector absorbs under 7 percent of new labour-market entrants. To absorb half, it would need to create formal jobs about seven times faster than it does today. Source: KNBS Economic Survey 2026; author’s calculation.
Composition decides who benefits. A boom in finance and telecoms rewards shareholders and skilled professionals in a few Nairobi towers. A boom in agro-processing, light manufacturing and logistics reaches farmers, machine operators and drivers across the country. The sectors Kenya’s capital avoids are precisely the ones whose growth would be most inclusive, so the misallocation this note describes is not only a matter of efficiency, it is a matter of distribution.
The result is visible in the distribution itself. Two in five Kenyans, 39.8 percent, lived below the national poverty line at the last count, a rate that runs from under 20 percent in Nairobi to 82.7 percent in Turkana; the income share of the top tenth exceeds 40 percent while the bottom tenth holds under 1 percent; and about 85 percent of employed youth work informally, with some 3.5 million young Kenyans in neither education, employment nor training.23 These are not separate social problems to be solved by transfers. They are the arithmetic of a private sector that cannot formalise the many.
THE ABSORPTION ARITHMETIC, TO 2035
backlog(t) = entrants(t) – formal absorption(t). At about 800,000 entrants and about 54,000 formal private jobs a year, the informal or jobless backlog grows by roughly 746,000 annually, near 7.5 million over a decade.
Author’s model, illustrative, holding current rates constant; KNBS Economic Survey 2026. A higher growth rate or a higher formal-employment elasticity would narrow the gap, and neither is on the current trend.
Formalisation is the mechanism that joins growth to inclusion. Every informal enterprise that becomes formal, every casual worker who gains a contract, narrows the gap between the few and the many. A private sector that builds the missing middle formalises the workforce as it grows. A private sector confined to a few champions and millions of survival units leaves the distribution exactly where it is. Inclusive growth in Kenya is not, in the end, a redistribution problem. It is a formalisation problem, and formalisation is a private-sector problem.
The sustainability the balance sheet misses
The formalisation argument carries a further implication, one the numbers so far have left implicit. Everything argued to this point is, in the end, a question of sustainability, in the full sense the word now carries in African boardrooms and among the development-finance institutions that increasingly price it. Kenya’s private sector does not lack a sustainability story. It has one of the best on the continent, and it is worth taking seriously before asking what it leaves out.
The disclosure architecture is genuinely ahead of the region. The Nairobi Securities Exchange has required annual environmental, social and governance disclosure from listed firms since 2021, the Central Bank has mandated climate-risk reporting from banks since 2022, a Green Finance Taxonomy is in place, and Kenya has committed to the international sustainability standards, IFRS S1 and S2, by 2027, ahead of most emerging markets.24 The champions have run with it.
Safaricom’s 2025 report puts its total societal impact at about 1.1 trillion shillings, several times its accounting profit, and carries a CDP A-list rating, a near-total recycling rate, a workforce that is 49 percent female and a net-zero commitment for 2050.25 Equity Group was ranked first in the world by the International Finance Corporation for its climate-finance contribution and now publishes an impact disclosure built with J.P.
Morgan; KCB was the first Kenyan lender accredited to the Green Climate Fund and has pushed green lending past a fifth of its loan book. This is not greenwashing. It is real, measured and, increasingly, audited.
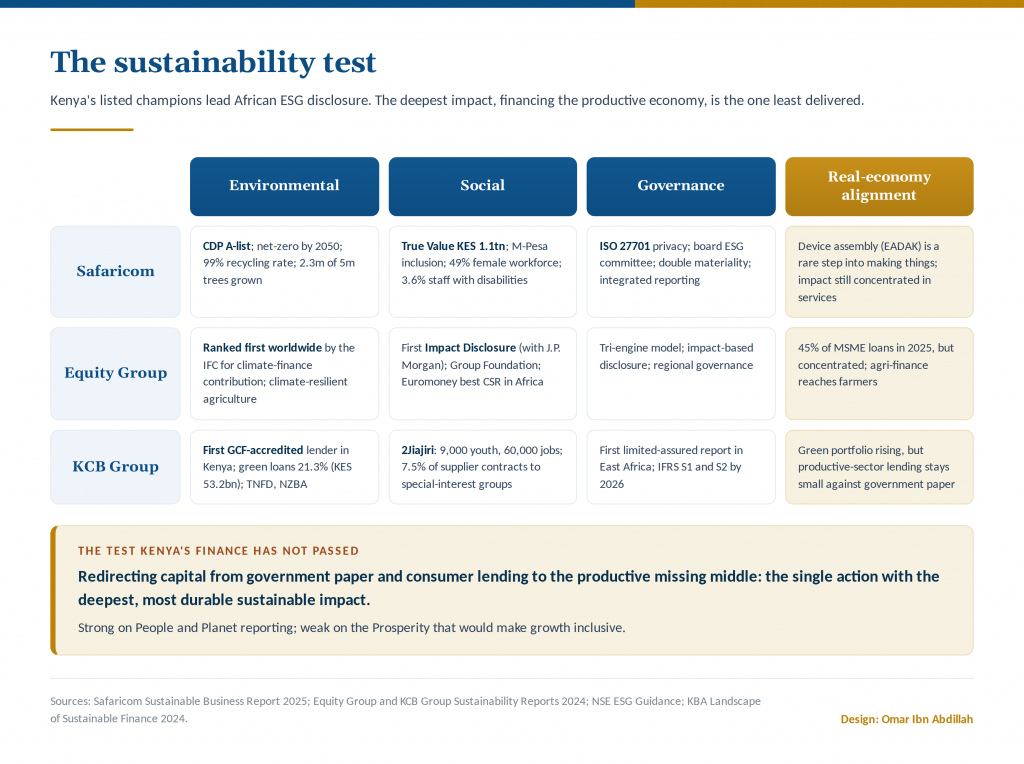
Figure 6. The sustainability scorecard of Kenya’s listed champions, and the alignment gap. Sources: company sustainability reports 2024 to 2025; NSE ESG Guidance; Kenya Bankers Association.
And yet the sustainability that matters most for Kenya is the one the reporting barely touches. The deepest and most durable impact a Kenyan financial champion could have is not another tree planted or another scholarship funded, worthy as those are. It is to move the nation’s savings out of government paper and consumer credit and into the productive firms that would turn a young population into a formally employed one.
That single reallocation would do more for poverty, for inclusion and for the social contract than the entire corporate-responsibility budget of the sector combined. It is also the one thing the incentives traced through this note actively discourage. Kenyan finance is strong on the impact it reports and weak on the impact it withholds.
The environmental picture holds the same paradox. Kenya runs one of the cleanest grids in the world, around nine-tenths renewable, geothermal and hydro, and its founders are building the physical green economy the continent needs, electric buses, pay-as-you-go solar, aquaculture.24 Yet the same clean power reaches the factory at the region’s highest tariff, so the country exports its green advantage as cheap electrons to its neighbours and imports the processed goods those neighbours make with them. A genuine climate asset is under-used as an industrial one. Sustainability, properly costed, is not only emissions avoided; it is value added at home.
The social ledger has an underside the glossy reports understate. The mobile-money rails that delivered world-leading inclusion also carry a fast-growing digital-lending industry with real problems of over-indebtedness, and a betting economy that leans on the young; the Central Bank is now moving to cut mobile-money charges precisely because inclusion and extraction have become hard to tell apart.24 An honest account of Kenyan finance records the inclusion and the harm in the same breath, and treats consumer protection as material, not cosmetic.
The governance and stability dimension is not soft either. The protests of June 2024 were, read in this frame, a sustainability event: a warning that a social contract stretched between a narrow taxed base and a large excluded majority is itself a material risk to every firm in the country. Corruption, ranked 121st of 180, taxes enterprise as surely as any levy. The most under-priced sustainability risk in Kenya is not carbon. It is the distance between the few the economy works for and the many it does not, the distance this whole note has measured.
The route out is the one Kenya is already sketching, and it is a partnership route on African terms. Local-currency guarantee vehicles such as the Dhamana Guarantee Company, blended finance that pairs development capital with domestic banks, the green-bond market the country pioneered in the region, and the continental market the African free trade area opens: these align the sustainability-minded capital that is looking for a home with the productive economy that needs one.24 The instruments exist.
What is missing is the decision to point them at the missing middle rather than at the reporting line. Sustainable growth in Kenya, in the end, is not a disclosure problem. It is the same allocation problem, wearing a different name.
Building on what Kenya already has
The temptation, reading the preceding sections, is to hand the state a long list of things to fix. That is the wrong instinct, and not only because Kenya’s fiscal room is thin. The Kenyan private sector has already proven what it can do when conditions allow. It built banks that lead the region, a telecoms operator that reshaped how a continent moves money, consumer goods firms that source and sell across borders.
The task is not to summon a private sector into being. It is to unblock the same four filters this note has traced, capital, cost, rules and trust, in the order in which they bind, so that the private sector Kenya already has reaches production and reaches the small firms now stranded in informality.
Four moves answer the four filters in turn. None asks the state to pick winners, all of them build on what Kenya already owns, and the first is the one that unlocks the rest.
The first filter is capital, and it binds hardest, so it comes first. The rate cap taught the lesson the hard way: the missing middle is not short of money, it is short of intermediation, and jamming the price of credit did not widen access, it drove the banks into government paper and cut the small borrower off. The remedy has two halves that must move together. The first half is to stop crowding out, through a credible return to fiscal discipline that curbs the state’s appetite for domestic borrowing; this frees bank balance sheets without a shilling of new spending. It is often called costless, and in budgetary terms it is: it asks for restraint rather than new outlay.
But June 2024 is the reminder that it is not politically free. Borrowing less without new revenue means either spending less, which cuts programmes someone depends on, or leaning harder on a tax base that has already reached the street; and doing it while the shilling is managed rather than fixed has its own transmission into prices. The honest description is not a free lunch but a high-return move with a real political price, which is precisely why it is so often deferred. But restraint alone will redirect nothing, because the banks’ preference for the secured and the safe survives a smaller deficit. The second half is to change how risk is priced and shared, so that a firm without land becomes bankable.
That means a Credit Guarantee Scheme built to the scale of the problem rather than the rounding error it is today, a working movable-collateral registry and a leasing market so that a machine or an invoice can secure a loan where a title deed cannot, shared credit information that lets a lender read a thin file, and deeper pools of scale-up equity from pension funds and the diaspora to carry firms across the gap between the early rounds and the later ones.
Fiscal discipline opens the room; intermediation reform fills it; neither works alone. Kenya’s own manufacturers have already costed that second half. The Manufacturing Priority Agenda 2025 asks the state to recapitalise the Credit Guarantee Scheme and ring-fence a fifth of it for industry, to raise the guaranteed loan ceiling from five to twenty million shillings and the tenure to eight years, to pass the Startup Bill that has waited since 2022, and to put the country’s dormant enterprise-finance institutions, the Kenya Industrial Estates, the Kenya Development Corporation and the industrial research institute, back to work.6 None of it is exotic, and all of it is Kenyan in origin.
The second filter is cost, and here the fix is a gift the country refuses to open. Kenya sits on abundant geothermal and buys Ethiopian hydropower at a fraction of what its thermal plants charge, yet it passes almost none of that advantage to the factory floor. Routing the clean, cheap power through to industrial tariffs, and stabilising the fuel-cost adjustments that make a bill impossible to forecast, would remove the single largest complaint of every manufacturer in the country, and it would do so with an asset already in the ground rather than a subsidy that must be found.
The third filter is rules, and the answer is a wider base rather than a heavier rate on the few who already pay. That means a tax and regulatory environment a firm can plan against for five years, because predictability is itself a form of investment promotion and it costs nothing. It also means a formalisation on-ramp that rewards the step up rather than punishing it, so that registering opens the door to credit and public contracts instead of only to a heavier burden, turning the informal 5.84 million from a population to be policed into a pipeline to be brought in. And it means a workforce trained for the sectors that are actually growing, including the creative and digital industries where Kenya has an edge, which matters more than another discretionary incentive.
The most grounded target of all is to aim Kenya’s real comparative advantage, its farms, at its factories. It is worth being blunt about where that advantage does not lie. Kenya will not out-compete Vietnam, Bangladesh or Ethiopia on the wage cost of cut-and-sew garment work; those economies pay less, subsidise more and have deeper light-manufacturing ecosystems, and a strategy that meets them head-on in low-wage assembly loses. Where Kenya already holds a genuine edge is in what grows in its highlands.
It is the world’s largest exporter of black tea, earning about 1.44 billion dollars in 2025; the second-largest exporter of cut flowers, supplying roughly two fifths of the European Union’s roses; and the leading African exporter of avocados.6
The weakness sits one step downstream: only about 5 percent of Kenyan tea is exported in processed, value-added form, and the government’s own target is to lift that toward 50 percent by 2027, a goal that will slip without the power, credit and predictability the earlier filters describe. Agro-industrialisation is not a slogan, it is the arithmetic of moving from selling the leaf to selling the packet, from the raw avocado to the processed oil, capturing at home the margin that is today added abroad. It builds on an advantage Kenya already owns rather than one it must lure from overseas, and it is the one industrial bet the country can make from a position of strength rather than imitation.
The fourth filter is trust in the field, the slowest to move and the one most tempting to skip. A firm stays small and informal in part because contract enforcement is uncertain, registration is friction without reward, and corruption, ranked 121st of 180, taxes enterprise as surely as any levy; devolution added a further thicket, forty-seven counties each charging their own fees on the same goods and trucks. The courts deserve their own line in this account.
Commercial disputes have historically taken years rather than months to resolve, and the judiciary has carried a backlog running to hundreds of thousands of cases, so a firm facing a broken contract cannot treat litigation as a realistic remedy.26 The consequence reaches further than the aggrieved party: it raises the price of every commercial relationship in the country, it is one reason lenders distrust movable collateral they may not be able to seize, and it deters the investment that would take a firm from small to medium.
A credit system cannot be repaired while the contracts beneath it are unenforceable. Harmonising that thicket, making registration a door to services rather than a trap, and giving a small firm a credible expectation that a contract will be honoured and a bribe will not be demanded, is what finally makes staying informal the worse choice rather than the safer one. This is institutional work, not a single reform, which is why it must begin now to bear fruit later.
None of this is exotic, and the sequence matters as much as the list. Capital first, because it binds the rest; cost and rules alongside, because they are within immediate reach; trust throughout, because it takes longest to rebuild. All of it draws on assets Kenya already holds, the champions, the entrepreneurial density, the diaspora capital, the diversified base, the regional reach.
The state’s task is not to pick winners but to unblock the channel, and the private sector will do the building. Kenya does not need to become Ethiopia or Vietnam. It needs to let the private sector it has built spread from the boardrooms of Westlands to the workshops of Kariobangi and the farms of the Rift Valley.
Coda
The question is not whether Kenya can grow, but for whom. The answer runs through the private sector. Growth reaches the many when the private sector that employs the many can invest, produce and formalise. In Kenya today it cannot, not because the capital or the entrepreneurs are missing, but because the incentives push both away from the work that would make growth inclusive.
That is a hopeful diagnosis, in its way. A country that lacked a private sector would face a generational task. Kenya has the private sector. What it lacks is an economy that lets that sector build. Fixing incentives is faster than building institutions from nothing, and it is squarely within Kenya’s own power. The real question is not whether Kenya’s private firms can carry inclusive growth; they can, and they are the only vehicle that can.
It is whether Kenya will free the channels that turn their investment into formal jobs, rising wages and a poverty rate that at last comes down. The country does not need to invent a new engine. It needs to let the one it has pull, so that growth stops being a figure in the national accounts and becomes, for the many, inclusive.
Notes
- Republic of Kenya, Sessional Paper No. 10 of 1965; Kimenyi and others, and World Bank historical accounts. ↩
- Economic Recovery Strategy 2003 to 2007; Vision 2030; lower-middle-income reclassification, 2014 (KNBS; World Bank). ↩
- FinAccess Household Surveys (CBK, KNBS, FSD Kenya); CBK, Bank Supervision Annual Report 2024. ↩
- InvestKenya and the Kenya PPP Directorate; US State Department, 2025 Investment Climate Statement; Kenya Law (Companies, Insolvency and Special Economic Zones Acts 2015; Movable Property Security Rights Act 2017); Startup Bill 2022, pending. ↩
- KNBS, MSME Basic Report (2016) and Draft MSME Policy (2025); State Department for MSME Development. ↩
- Kenya Association of Manufacturers, Manufacturing Priority Agenda 2025. On agricultural exports: Tea Board of Kenya (tea earnings about 1.44 billion dollars in 2025, world’s largest black-tea exporter); Kenya’s horticulture and floriculture data (second-largest cut-flower exporter, about 40 percent of EU roses); processed-tea share around 5 percent with a 50 percent target by 2027. ↩
- Company results, 2024/25; Equity Group and KCB Group financial statements; African Business and Financial Times rankings, 2025 to 2026. ↩
- Partech, Africa Tech Venture Capital Report 2025. ↩
- Central Bank of Kenya, credit, public-debt, sectoral-credit and lending-rate series, 2025 to 2026; National Treasury, Credit Guarantee Scheme and 2025 Budget Policy Statement; African Development Bank, Kenya Economic Outlook 2026.; on the 2016 to 2019 interest-rate cap (Banking (Amendment) Act 2016, in force September 2016, repealed 2019), Central Bank of Kenya, IMF, World Bank and Kenya Bankers Association assessments. On the empirical strength of the crowding-out link: a panel of nine Tier 1 Kenyan banks, 2005 to 2023, finds a significant negative effect of banks’ government-securities holdings on private-sector credit, persisting under a one-period lag; KIPPRA, Dynamics of Domestic Debt in Kenya, on banks’ holdings as a source of crowding-out susceptibility. ↩
- Movable Property Security Rights Act, 2017, and the Business Registration Service collateral registry (initial security notices rose to 55,350 in the first four months of 2026); OECD, Secured Lending for SMEs (2022), on why lenders in emerging markets still favour immovable collateral. ↩
- StartupBlink, Global Startup Ecosystem Index 2025; Startup Genome, Nairobi profile 2025; iHub and company disclosures. ↩
- KNBS, national accounts and Economic Survey 2026; UNIDO, Competitive Industrial Performance Index; Kenya Association of Manufacturers. ↩
- African Center for Economic Transformation, Growth with DEPTH and the Kenya Country Economic Transformation Outlook 2025. ↩
- EPRA tariff and electricity statistics, 2025; GlobalPetrolPrices. ↩
- Republic of Kenya: Finance Acts 2023 to 2025 and the Tax Laws (Amendment) Act 2024 (National Treasury; KPMG and PwC analyses). ↩
- National Treasury, FY2024/25 revenue and Medium-Term Revenue Strategy 2024/25 to 2026/27; KRA and PwC Tax Summaries 2025; World Bank. ↩
- Republic of Kenya, National Treasury and Parliamentary Budget Office: FY2025/26 expenditure of about 4.3 trillion shillings, of which development spending is roughly 693 billion and recurrent close to three quarters; the Treasury has stated that debt service absorbs nearly half of ordinary revenue (KPMG and Cytonn budget analyses, 2025 to 2026). Public debt under Kibaki: about 633 billion shillings in 2003, about 1.79 trillion in 2013. On debt composition: external debt about 46 percent of the total at end-June 2025 (National Treasury; African Development Bank), of which roughly two thirds is US-dollar denominated, exposing the shilling cost of servicing to exchange-rate movements (Controller of Budget; AfDB, 2025). ↩
- UNCTAD, World Investment Report 2025; Kenya Investment Authority; CBK diaspora remittance data, 2025. ↩
- Transparency International, Corruption Perceptions Index 2024. ↩
- On Ethiopian and Rwandan industrial policy: Oqubay; Diao and others (2021); Blattman and Dercon (2018); Overseas Development Institute. ↩
- Konza Technopolis Development Authority; press and expert accounts of the 14.5 billion dollar project and its target of 20,000 residents by 2020 (Thomson Reuters Foundation; Business Daily). ↩
- KNBS, Economic Survey 2026. ↩
- KNBS, Kenya Continuous Household Survey and 2022 poverty report; World Bank. ↩
- Nairobi Securities Exchange ESG Disclosures Guidance (2021); CBK Guidance on Climate-Related Risk (2022); Kenya Green Finance Taxonomy; IFRS S1 and S2 from 2027; FSD Africa (Dhamana Guarantee Company, 2024; Acorn green bond); CBK National Financial Inclusion Strategy 2025 to 2028. ↩
- Safaricom, Sustainable Business Report 2025; Equity Group and KCB Group Sustainability Reports 2024. ↩
- Judiciary of Kenya, case-load reports: a national backlog of some 549,556 pending cases (2018) and average commercial-division disposal times measured in years before court-annexed mediation. ↩
References
- Blattman, C. and Dercon, S. (2018). The Impacts of Industrial and Entrepreneurial Work on Income and Health. American Economic Journal: Applied Economics.
- Diao, X., McMillan, M. and others (2021). Africa’s Manufacturing Puzzle: Evidence from Tanzanian and Ethiopian Firms. National Bureau of Economic Research, Working Paper 28344.
- Kenya Association of Manufacturers (2025). Manufacturing Priority Agenda 2025.
- Kenya National Bureau of Statistics (2026). Economic Survey 2026.
- Organisation for Economic Co-operation and Development (2025). Revenue Statistics in Africa 2025: Kenya.
- PwC (2025). Kenya: Corporate Tax Summary.
- Republic of Kenya (2025). Finance Act 2025; National Treasury, Medium-Term Revenue Strategy 2024/25 to 2026/27.
- KPMG (2025). Kenya Finance Act 2025: Analysis.
- Kenya National Bureau of Statistics (2016). Micro, Small and Medium Establishment Survey: Basic Report.
- Ministry of Cooperatives and MSME Development (2025). Draft Micro, Small and Medium Enterprises Policy 2025.
- Oqubay, A. (2019). The Structure and Performance of the Ethiopian Manufacturing Sector.
- Overseas Development Institute (2018). Manufacturing in Africa: Factors for Success.
- Partech (2026). Africa Tech Venture Capital Report 2025.
- Rodrik, D. (2016). Premature Deindustrialization. Journal of Economic Growth.
- UNCTAD (2025). World Investment Report 2025.
- Republic of Kenya (1965). Sessional Paper No. 10 of 1965: African Socialism and its Application to Planning in Kenya.
- Republic of Kenya (2008). Kenya Vision 2030.
- Central Bank of Kenya (2024). Bank Supervision Annual Report 2024.
- Central Bank of Kenya, KNBS and FSD Kenya (2024). FinAccess Household Survey 2024.
- Republic of Kenya. Companies Act 2015, Insolvency Act 2015, Movable Property Security Rights Act 2017, Special Economic Zones Act 2015 and Public Private Partnership Act 2021 (Kenya Law).
- US Department of State (2025). 2025 Investment Climate Statement: Kenya.
- Kenya National Bureau of Statistics (2023). Kenya Continuous Household Survey and 2022 Poverty Report.
- World Bank (2025). Kenya Poverty and Equity Brief.
- African Center for Economic Transformation (2025). Kenya Country Economic Transformation Outlook.
- African Development Bank (2026). Kenya Economic Outlook.
- Republic of Kenya, National Treasury (2025). Credit Guarantee Scheme; 2025 Budget Policy Statement.
- Safaricom PLC (2025). Sustainable Business Report 2025.
- Equity Group Holdings (2024). Sustainability Report and Sustainable Development Impact Disclosure.
- KCB Group (2024). Sustainability Report.
- Nairobi Securities Exchange (2021). ESG Disclosures Guidance Manual; Kenya Bankers Association (2024). Landscape of Sustainable Finance in Kenya’s Banking Industry.
- StartupBlink (2025). Global Startup Ecosystem Index 2025.
- UNIDO (2023). Competitive Industrial Performance Index.
- Barngetuny, J. (2025). Revisiting the Multiplier and Crowding-Out Trade-off: Empirical Evidence from Kenya. International Journal of Finance and Accounting, 4(1).
- KIPPRA (2021). Dynamics of Domestic Debt in Kenya: Composition, Risks, and Financial Market Stability. Nairobi: Kenya Institute for Public Policy Research and Analysis.
- Republic of Kenya, National Treasury (2025). Annual Public Debt Management Report 2024/2025, and Medium-Term Debt Management Strategy 2026/27 to 2028/29.
- Office of the Controller of Budget (2026). National Government Budget Implementation Review Report, on external-debt currency composition and exchange-rate risk.
- African Development Bank (2025). Unpacking the Drivers of Public Debt Dynamics in Kenya.
- Tea Board of Kenya (2026). Industry Performance Report 2025; Kenya National Bureau of Statistics, horticulture and floriculture export data.